

Cyllo Built-in Reports per Module Documentation
Introduction
Cyllo provides a comprehensive set of built-in reports across every major module. These reports are accessible directly from the Reporting menu within each module and require no additional configuration or setup to use. Each report is powered by the shared Cyllo database, meaning the data shown is always real-time and reflects actions taken across all connected modules — no manual exports or data synchronisation are needed.
Reports in Cyllo are available in multiple views — list, pivot, and graph — allowing users to switch between formats depending on whether they need a summary, a detailed breakdown, or a visual trend. All reports support standard filters, group-by options, and can be exported to XLSX or PDF where applicable.
For custom cross-module dashboards and AI-powered analysis beyond the built-in reports, see the Cyllo Analytics section.
1. Sales Reports
The Sales module provides reports covering the full quote-to-order lifecycle, pricing performance, and salesperson productivity.
1.1 Sales Analysis
Sales Analysis is the primary reporting view in the Sales module. It gives a breakdown of sales performance by product, salesperson, customer, sales team, or time period. Users can pivot across any combination of these dimensions to identify top-performing products, high-value customers, and seasonal trends.
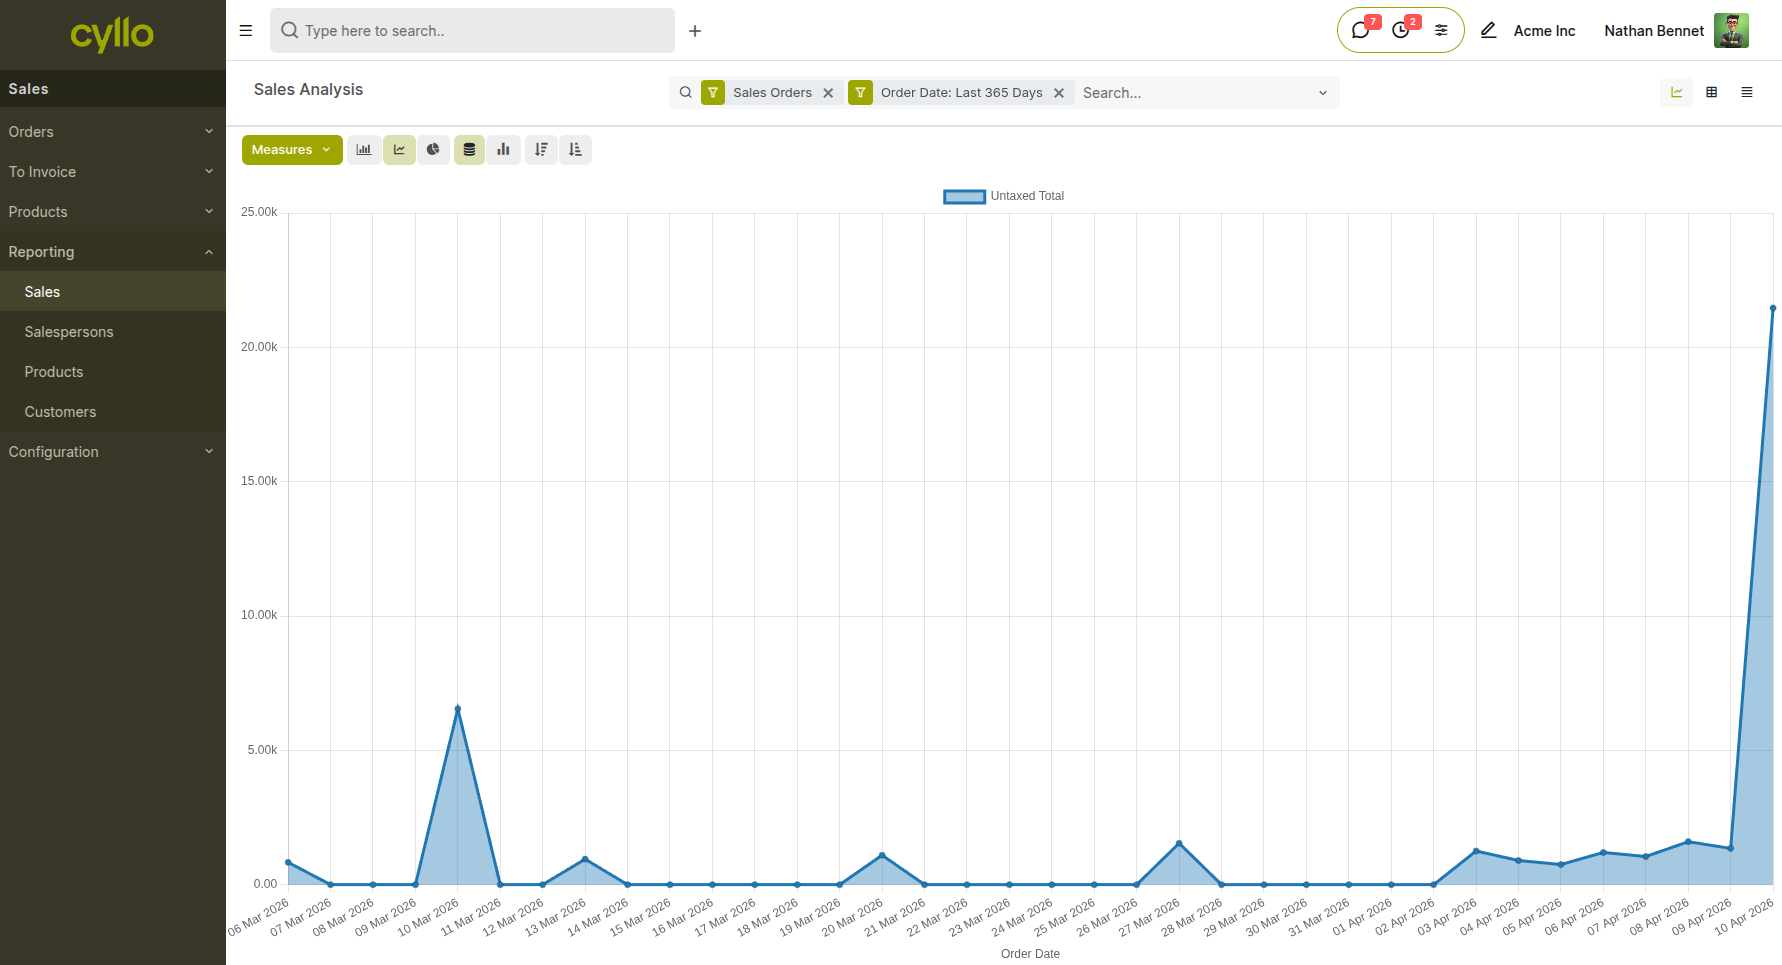
Fig 1.1 — Sales Analysis report in graphical view filtered by orders in last 365 days, showing revenue totals
How to access Sales Analysis:
- Go to Sales → Reporting → Sales
- Use the Filters bar to narrow by date range, salesperson, sales team, or order status
- Use the Group By options to pivot the report — group by Product, Customer, Salesperson, or Month
- Switch between Pivot, Graph, and List views using the view toggles in the top right Key Fields
- Untaxed Total: Revenue figure excluding taxes — used for sales performance comparison
- Quantity Ordered: Units sold per product or category in the selected period
- Salesperson: Filter to individual rep performance across the date range
- Order Date: Group by week, month, or quarter to identify trends
1.2 Salesperson Reports
Salesperson Reports provide insights into individual sales performance. They allow you to analyze revenue, order count, and overall contribution of each salesperson over a selected period.
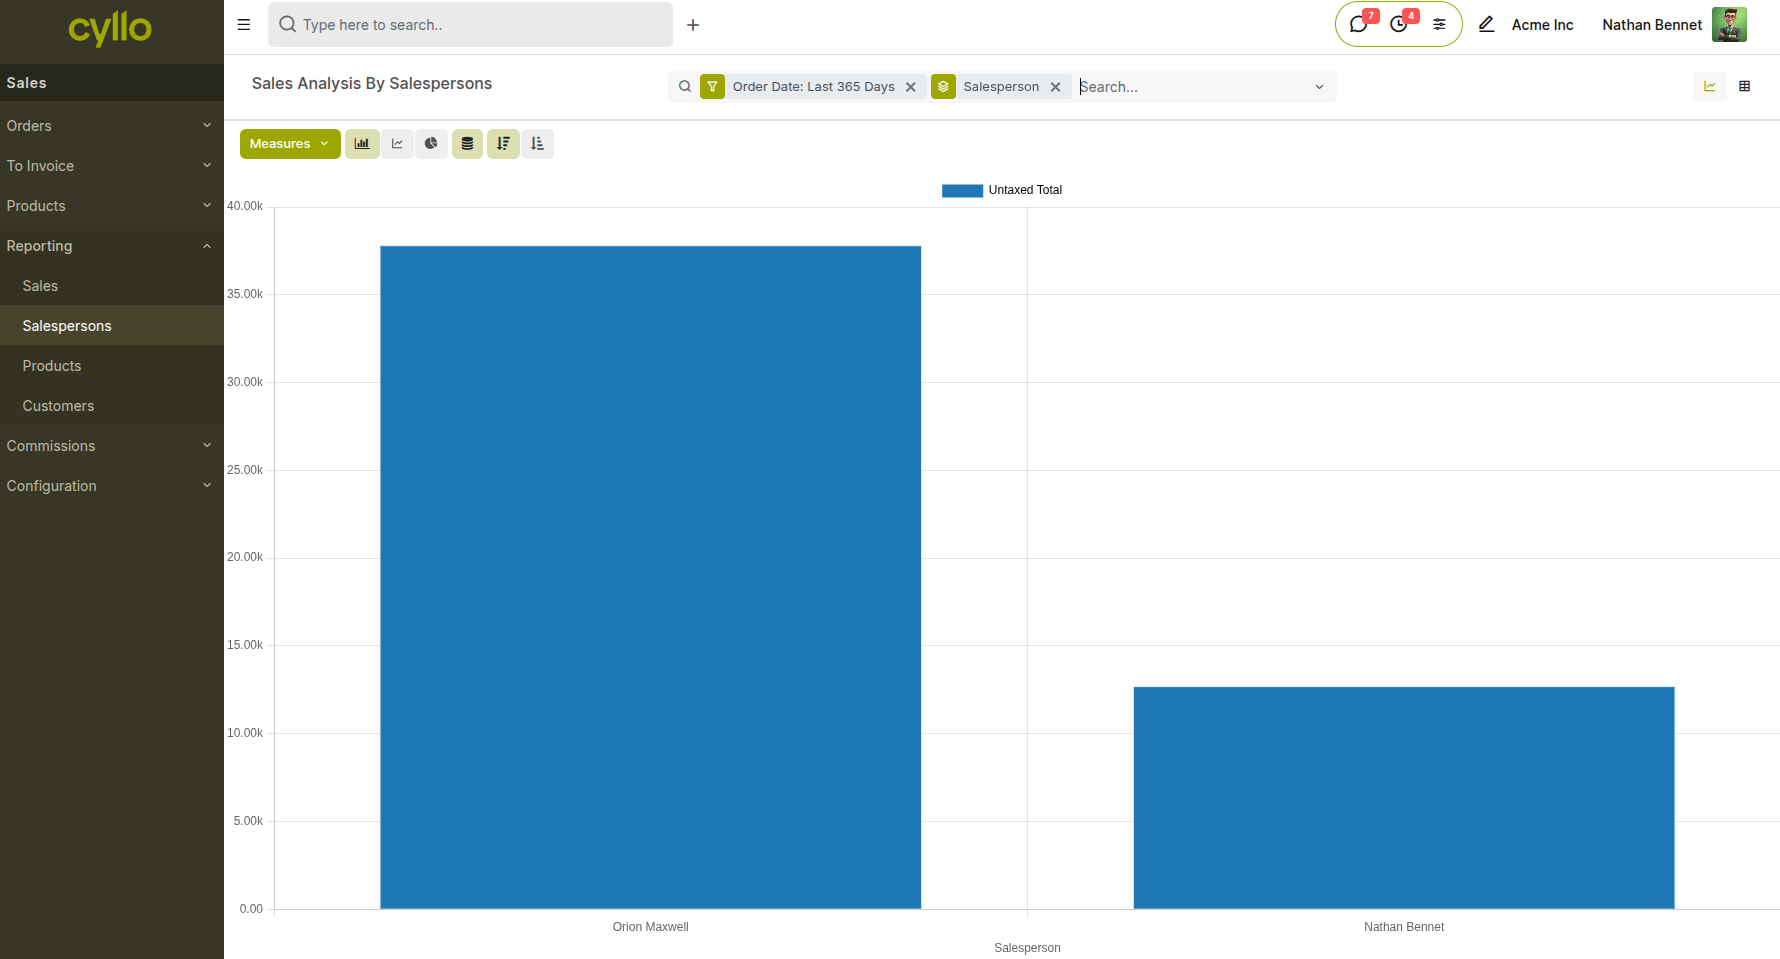
Fig 1.2 — Salesperson report in pivot or graph view showing total sales grouped by salesperson
How to access Salesperson Reports:
- Go to Sales → Reporting → Salespersons
- Use filters such as Date, Sales Team, or Status
- Apply Group By → Salesperson to compare performance
- Switch to Pivot or Graph view for visual analysis
1.3 Product Report
The Product report provides insights into product-level performance, helping identify top-selling products and revenue contribution.
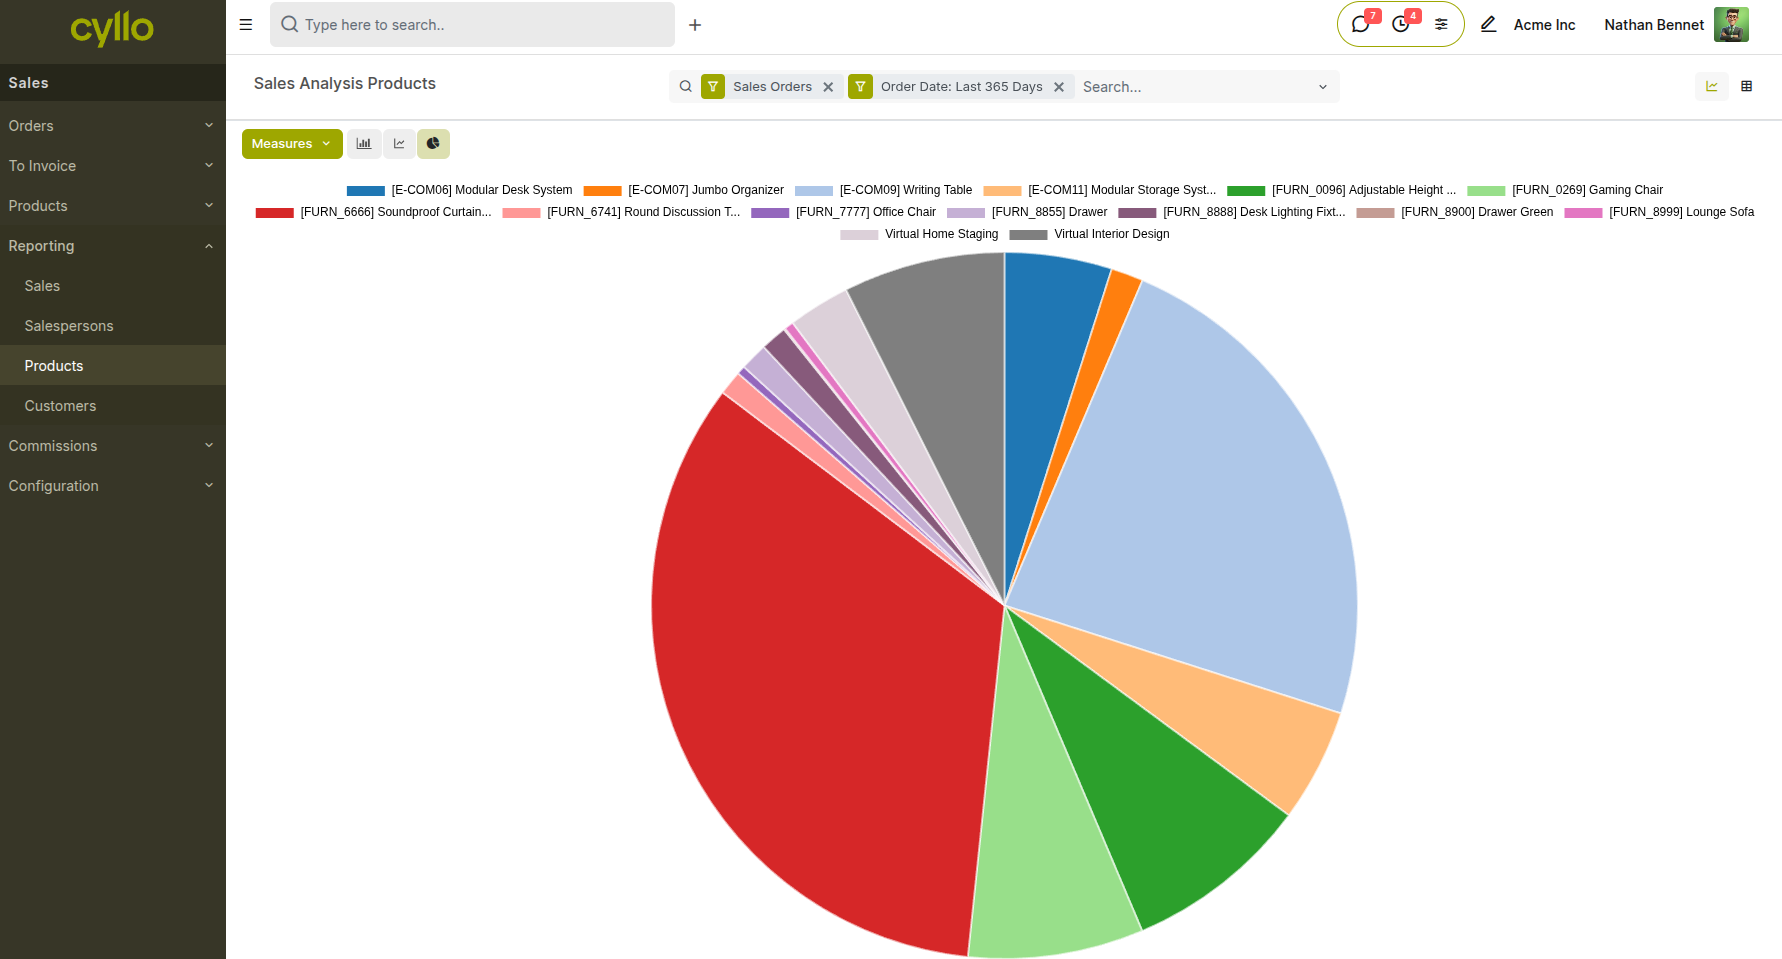
Fig 1.3 — Product report showing sales grouped by product
How to access:
- Go to Sales → Reporting → Products
- Analyze sales by product, category, or quantity sold
- Use Pivot or Graph view for deeper insights
1.4 Customer Report
The Customer report helps analyze sales performance by customer, allowing businesses to identify key customers and purchasing patterns.
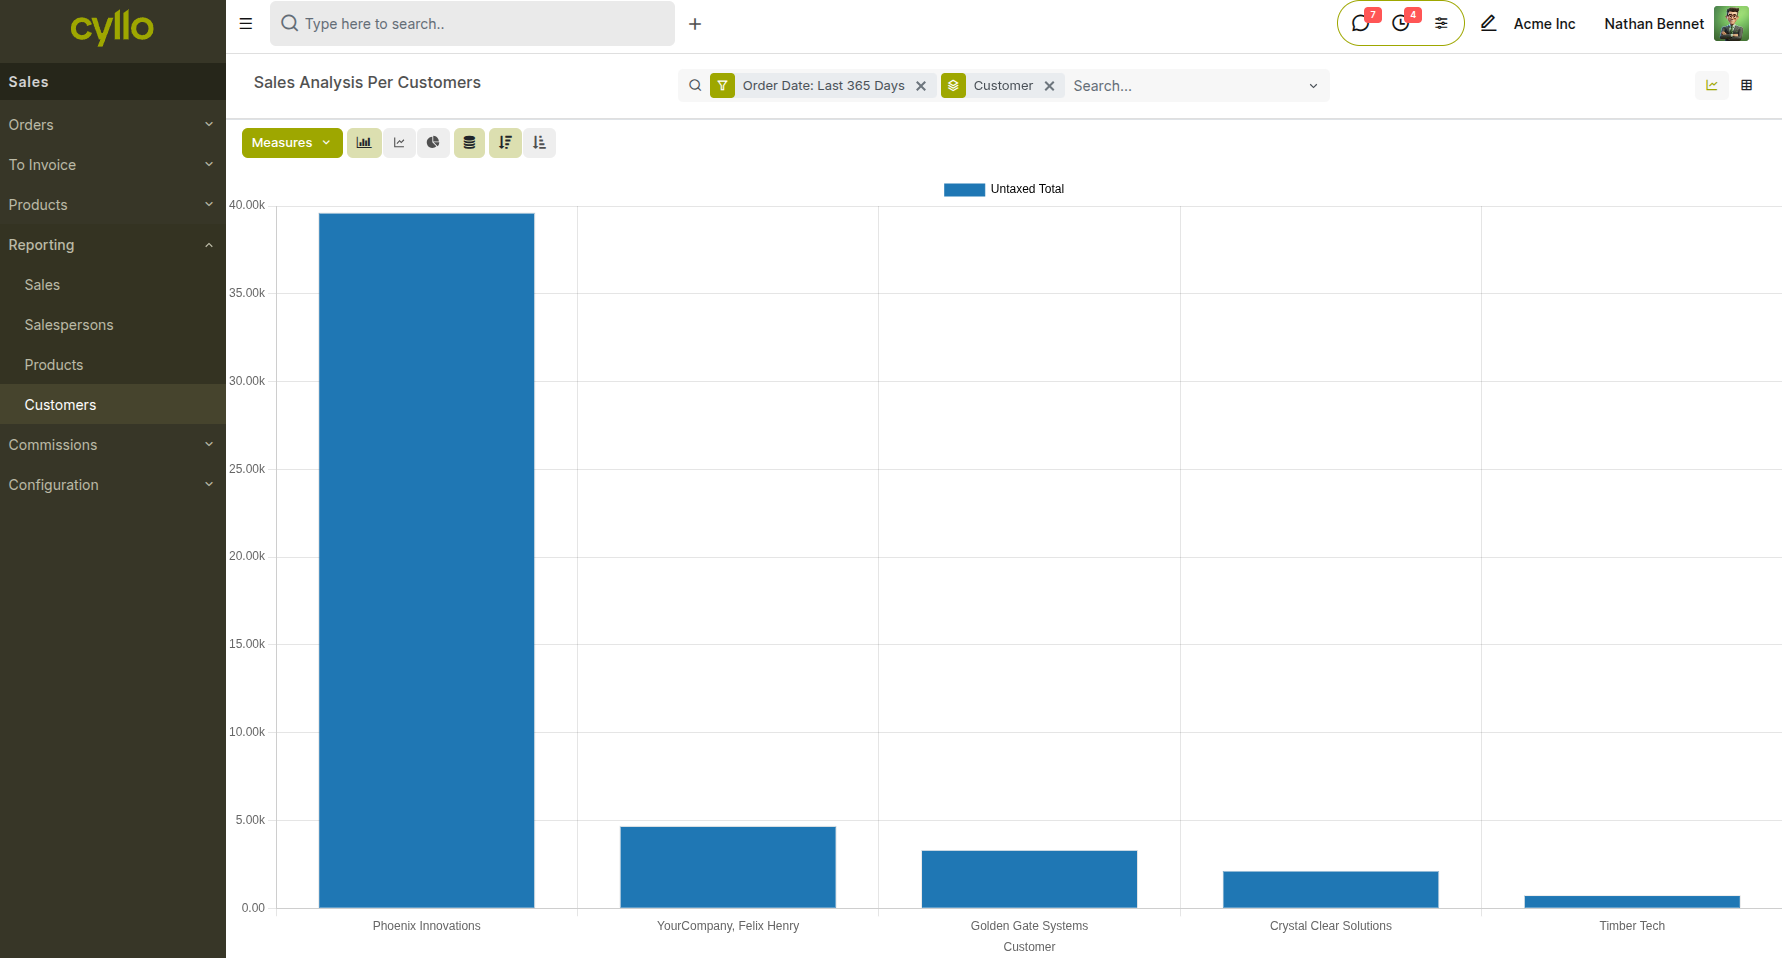
Fig 1.4 — Customer report showing revenue grouped by customer
How to access:
- Go to Sales → Reporting → Customers
- Apply filters like Date or Salesperson
- Use Group By → Customer to evaluate customer contribution
1.5 Commission Dashboard
The Commission Dashboard provides a visual summary of commission performance, including total sales, earned commissions, and team distribution.
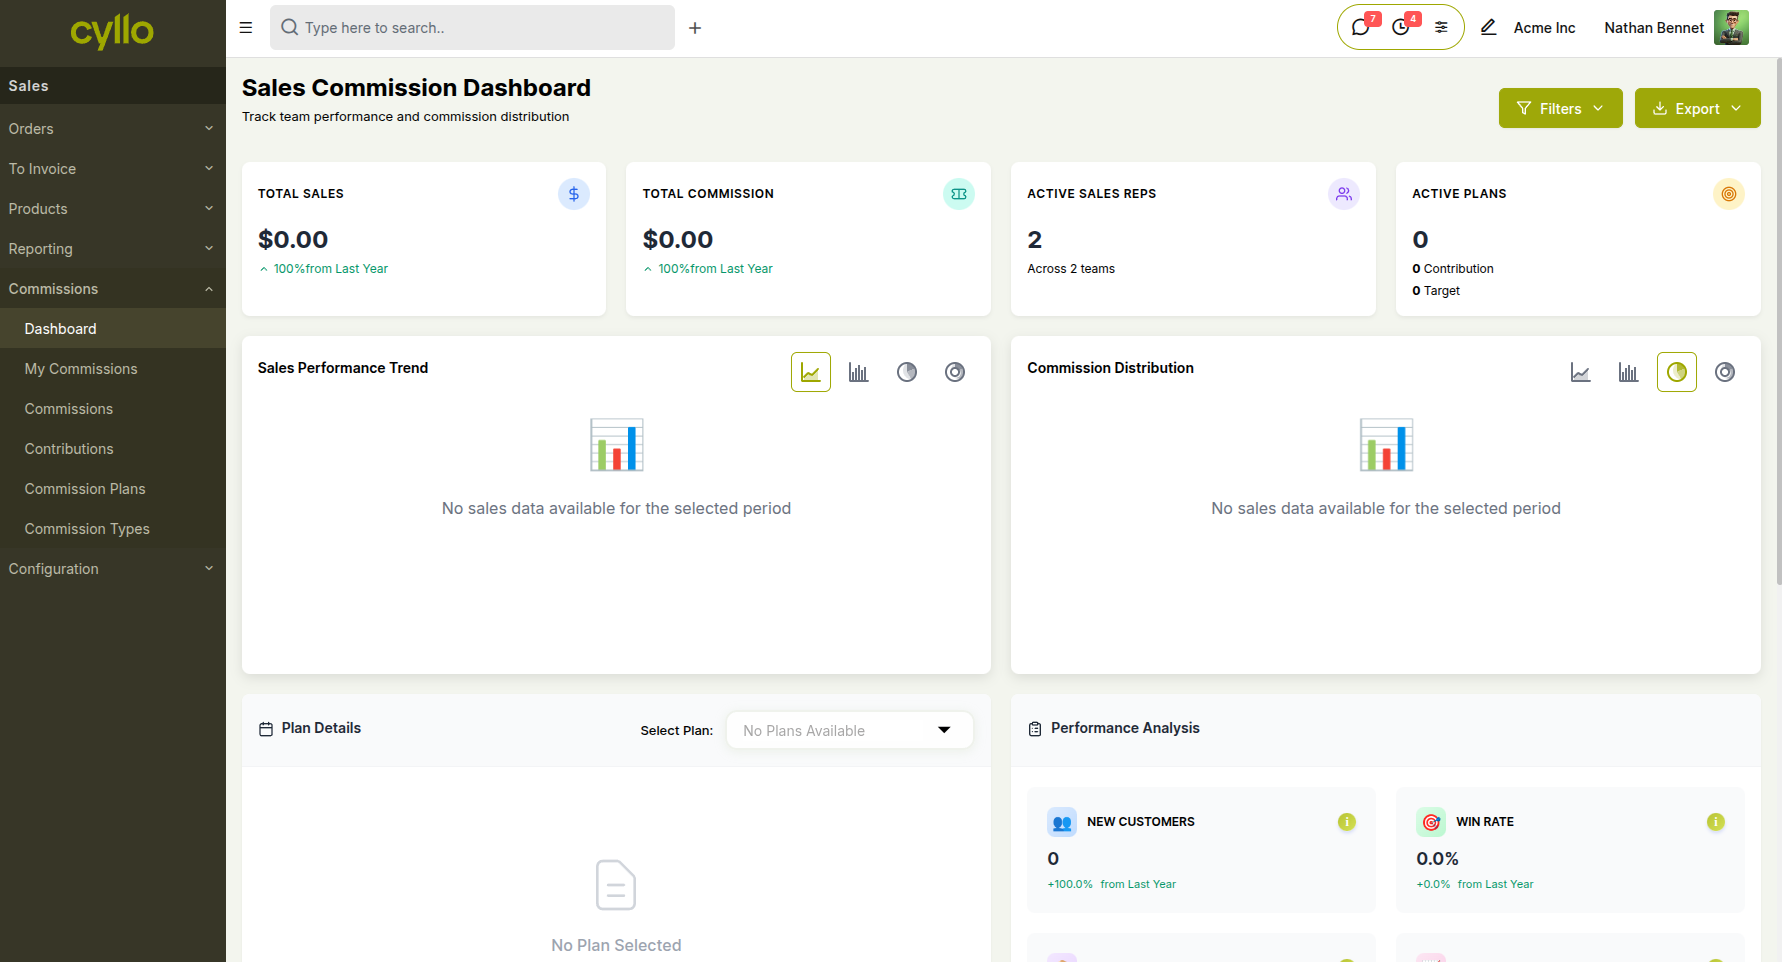
Fig 1.5 — Sales Commission Dashboard
2. CRM Reports
The CRM module provides reports on lead and opportunity performance, team activity, and AI-based lead scoring.
2.1 Pipeline Analysis
Pipeline Analysis gives a breakdown of opportunities by stage, salesperson, sales team, expected revenue, and probability. It is the primary tool for sales managers to review forecast accuracy and identify where deals are stalling in the pipeline.
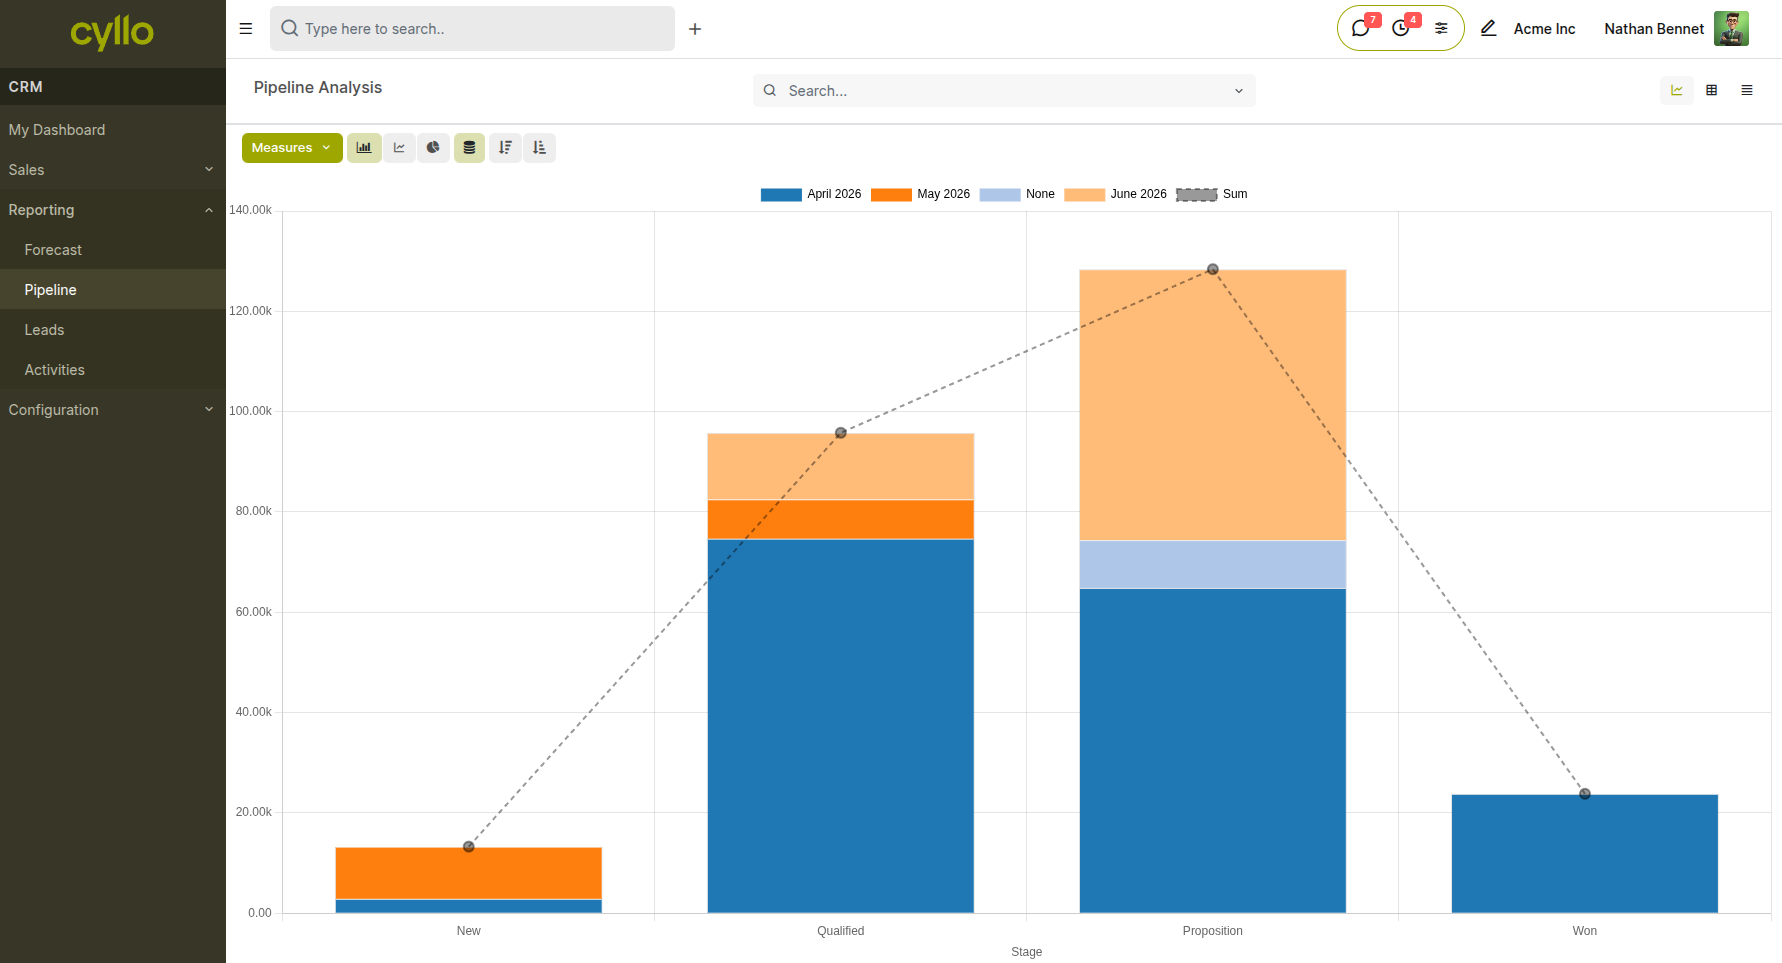
Fig 2.1 — CRM Pipeline Analysis in graph view showing stacked bar chart of opportunities by stage and expected revenue value
How to access Pipeline Analysis:
- Go to CRM → Reporting → Pipeline
- Group by Stage, Salesperson, or Sales Team to compare performance
- Filter by Creation Date or Expected Closing Date to narrow the view to a specific period
- Switch to Pivot view to see revenue totals and opportunity counts across multiple dimensions simultaneously
2.2 Activity Reports
The Activity Report shows all scheduled and overdue activities across the CRM pipeline — calls, emails, and meetings — giving managers visibility into team follow-up discipline and upcoming workload.
How to access the Activity Report:
- Go to CRM → Reporting → Activities
- Filter by activity type (Call, Email, Meeting) or by salesperson
- Overdue activities are highlighted; use this report in weekly pipeline reviews to ensure nothing is missed
2.3 Churn Prediction and Sales Forecasting
These AI-powered reports are available through the Sale Analytics module. The Churn Prediction report identifies customers at risk of not reordering based on historical purchase behavior. The Sales Forecasting report uses the Prophet time-series model to project future revenue with confidence intervals.
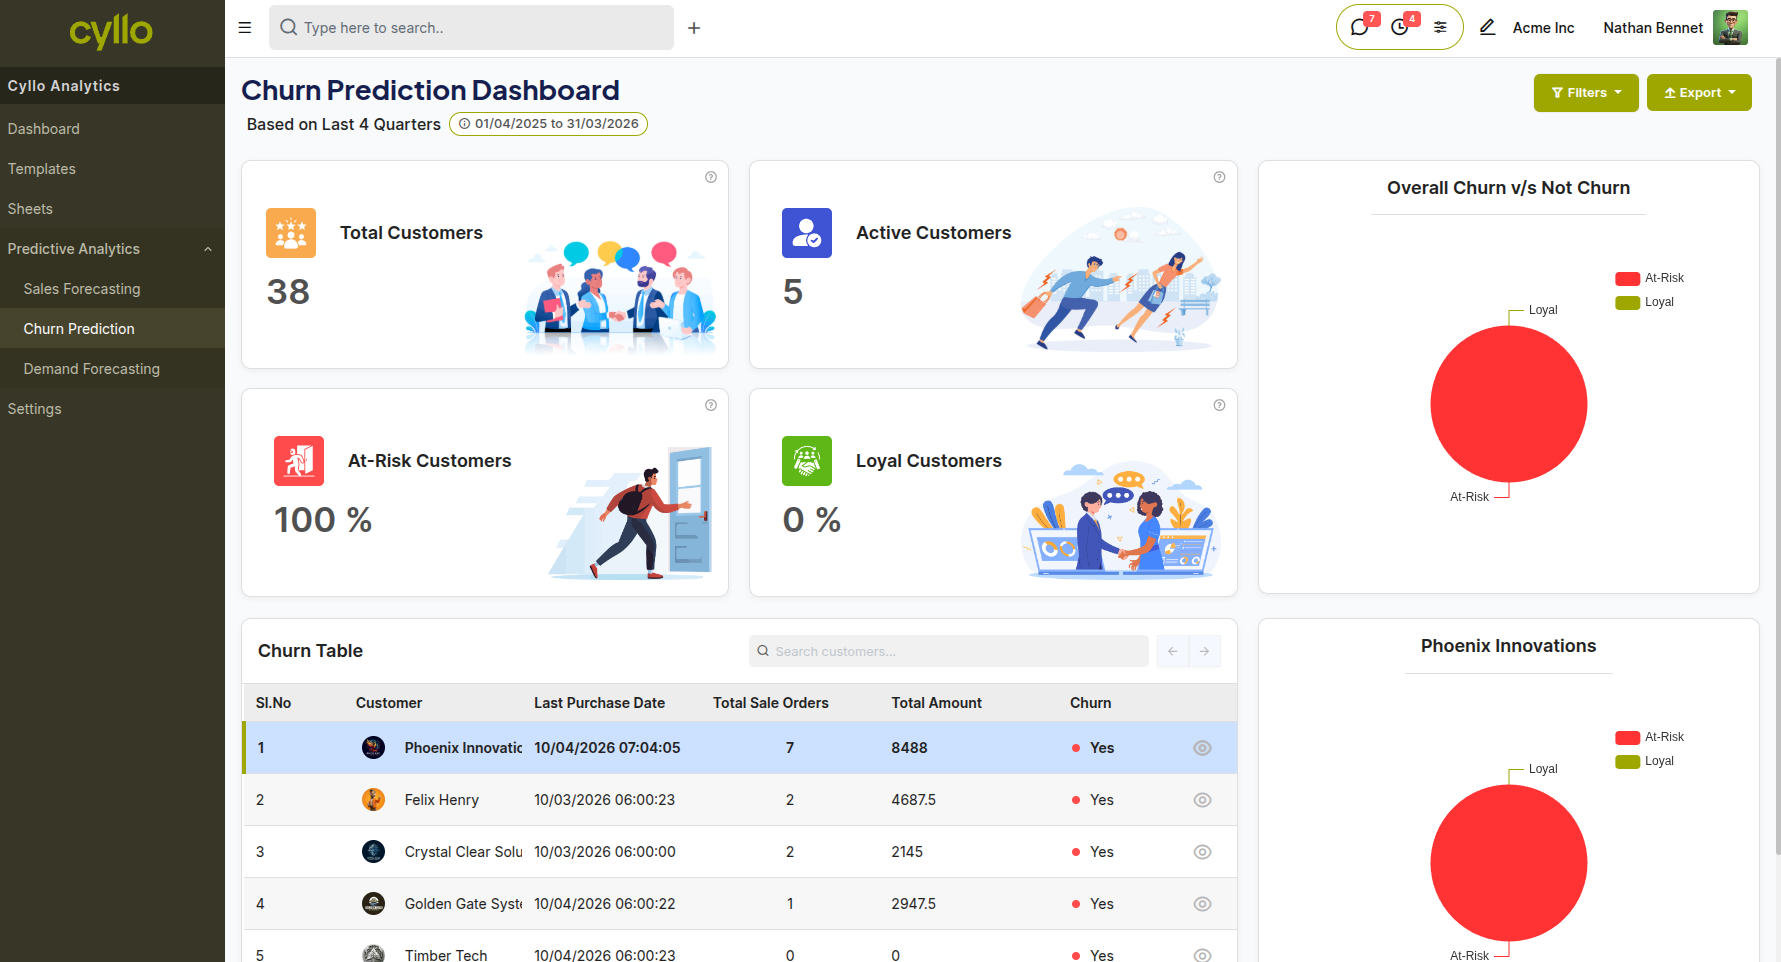
Fig 2.2 — Churn Prediction dashboard showing customer risk scores and segmentation
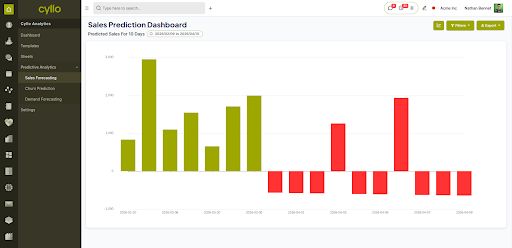
Fig 2.3 — Churn Prediction dashboard showing customer risk scores and segmentation; Sales Forecast chart with confidence band showing projected monthly revenue
How to access these reports:
- Go to Sales → Reporting → Churn Analysis for the churn prediction view
- Go to Sales → Reporting → Sales Forecast for the Prophet-based revenue forecast
- Configure the forecast period (daily, weekly, monthly) and date range from the filter bar
- Export results to XLSX for use in presentations or management reporting
Note
These reports require the Sale Analytics module (cyllo_sale_analytics) to be installed.
3. Inventory Reports
The Inventory module provides reports covering stock levels, valuation, product movement, and lot-level traceability.
3.1 Stock Valuation Report
The Stock Valuation Report shows the financial value of all on-hand stock, calculated using the configured costing method (Standard Price, Average Cost, or FIFO). It gives finance teams an accurate view of inventory value for balance sheet reporting.
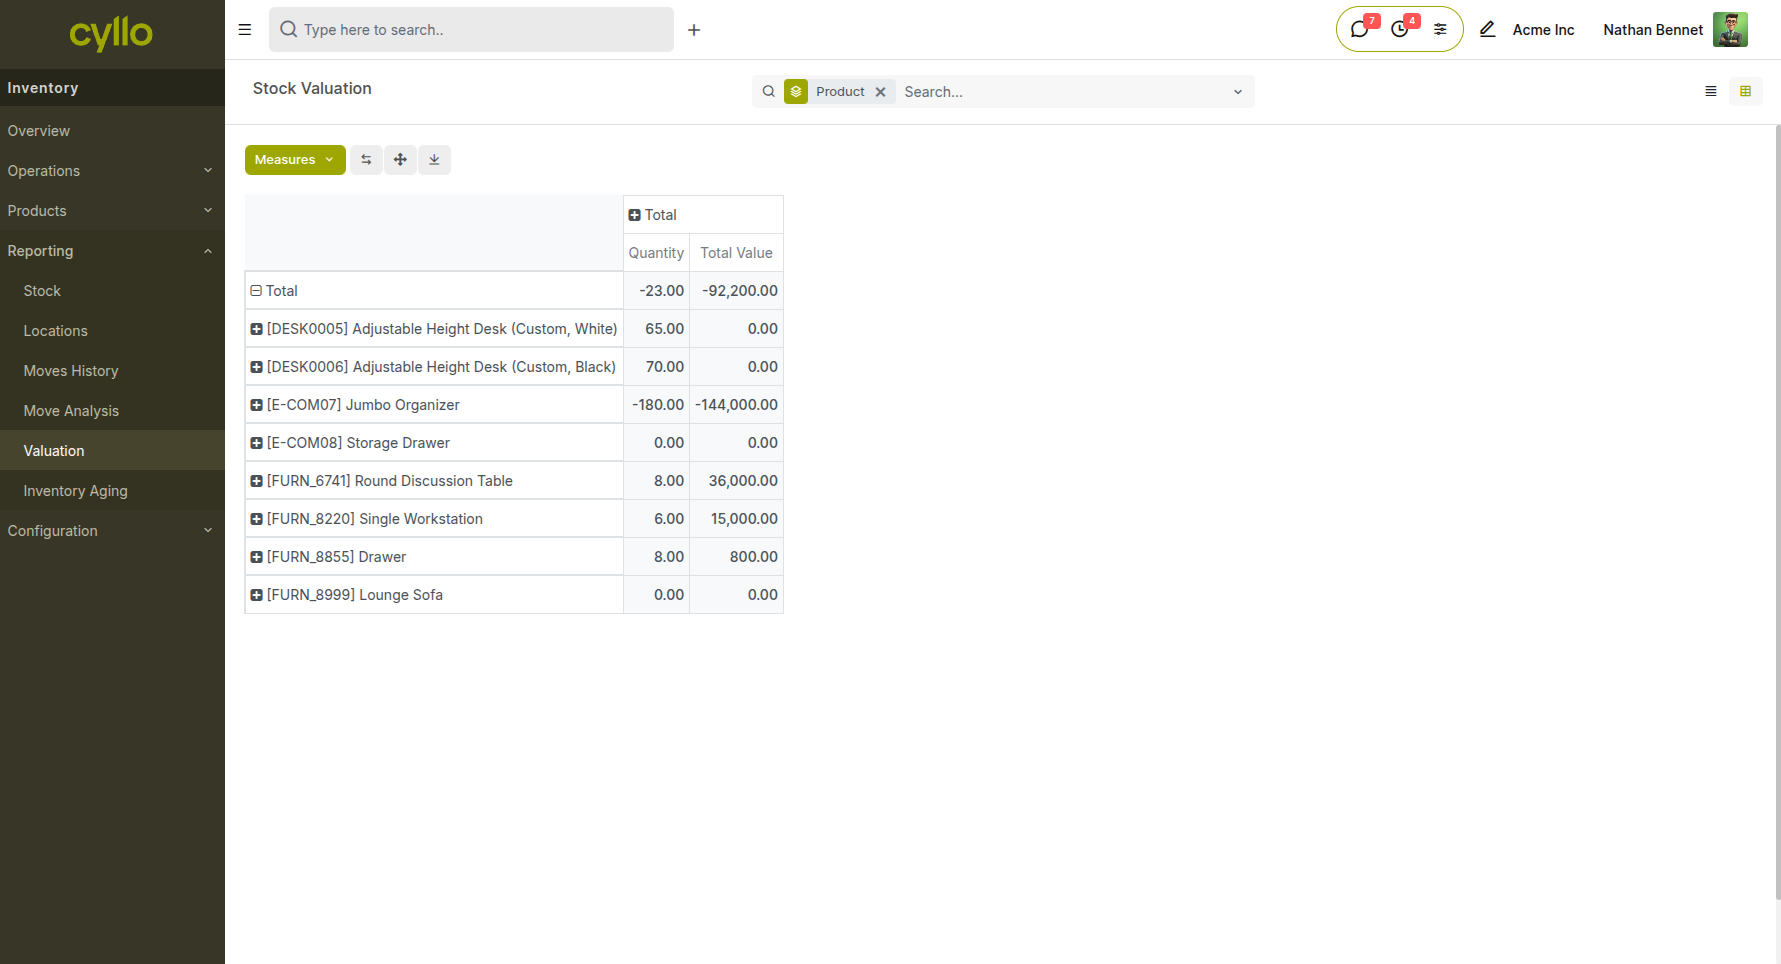
Fig 3.1 — Stock Valuation Report showing product, quantity on hand and total value; grouped by product
How to access the Stock Valuation Report:
- Go to Inventory → Reporting → Valuation
- Filter by product category, warehouse, or date to narrow the scope
- The report reflects real-time on-hand quantities and current cost per unit
3.2 Stock Report
The Stock report shows the current on-hand and reserved quantities for products across different locations.
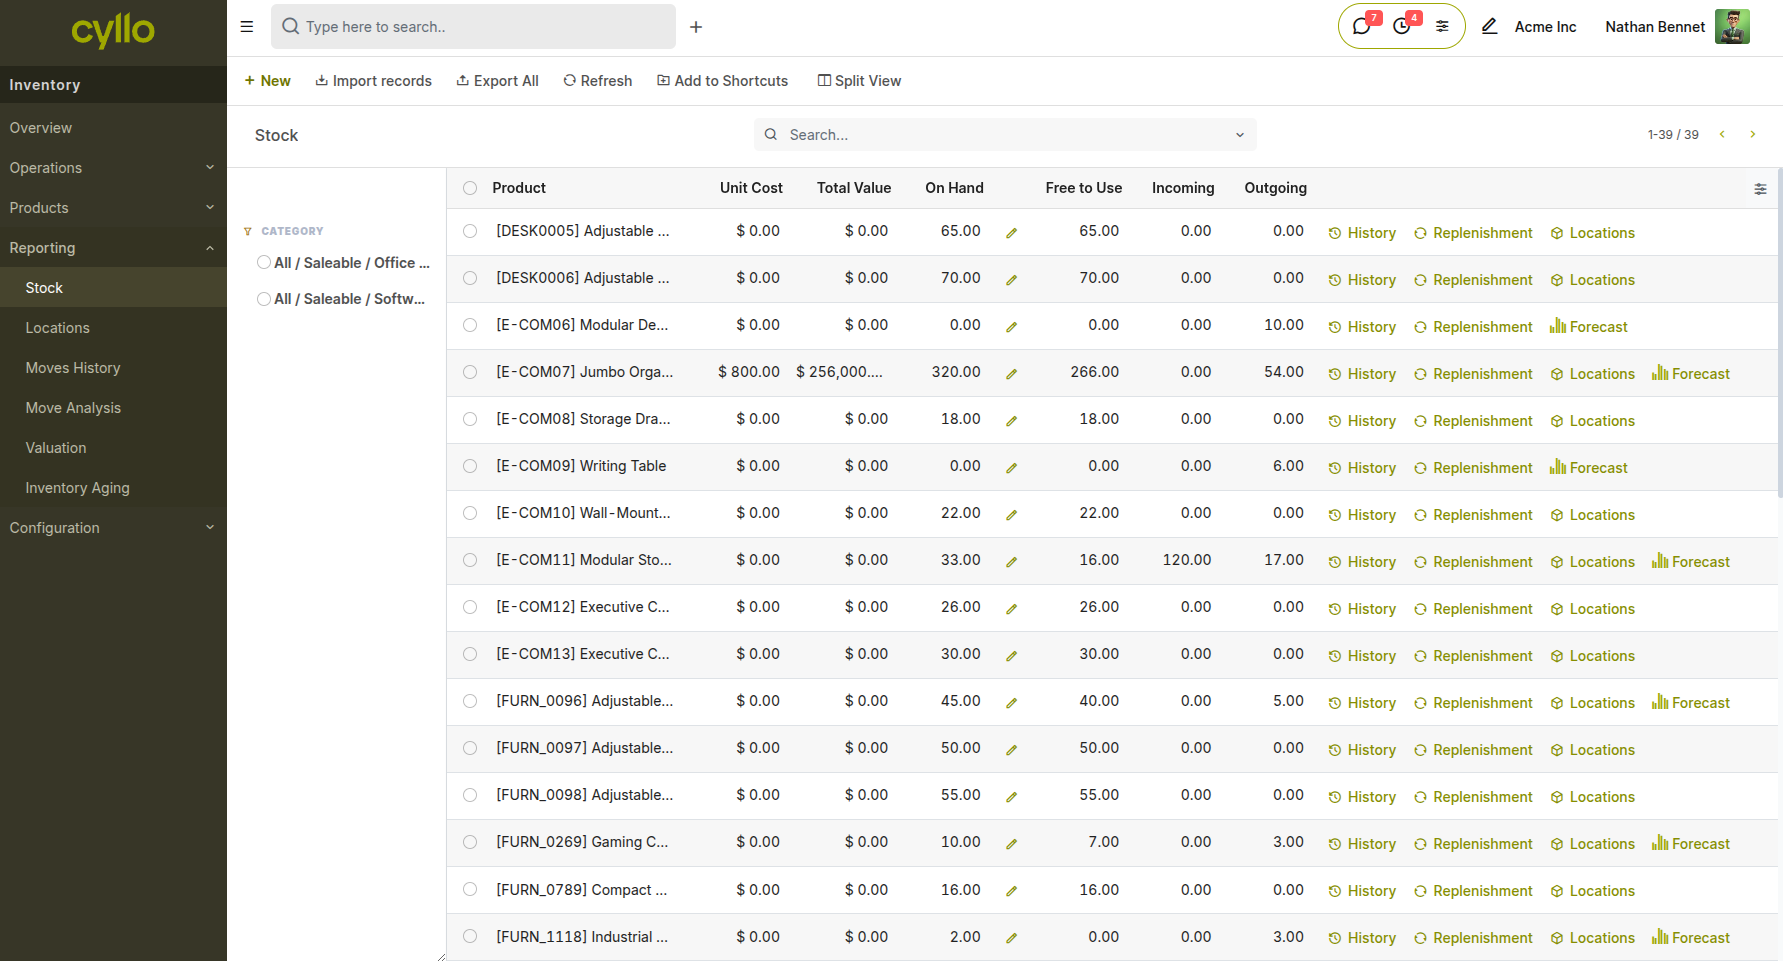
Fig 3.2 — Stock report showing product quantities by location
How to access:
- Go to Inventory → Reporting → Stock
- View quantities by product or location
- Use filters and group by for analysis
3.3 Location Report
The Location report provides stock details grouped by storage locations, helping track inventory distribution within warehouses.
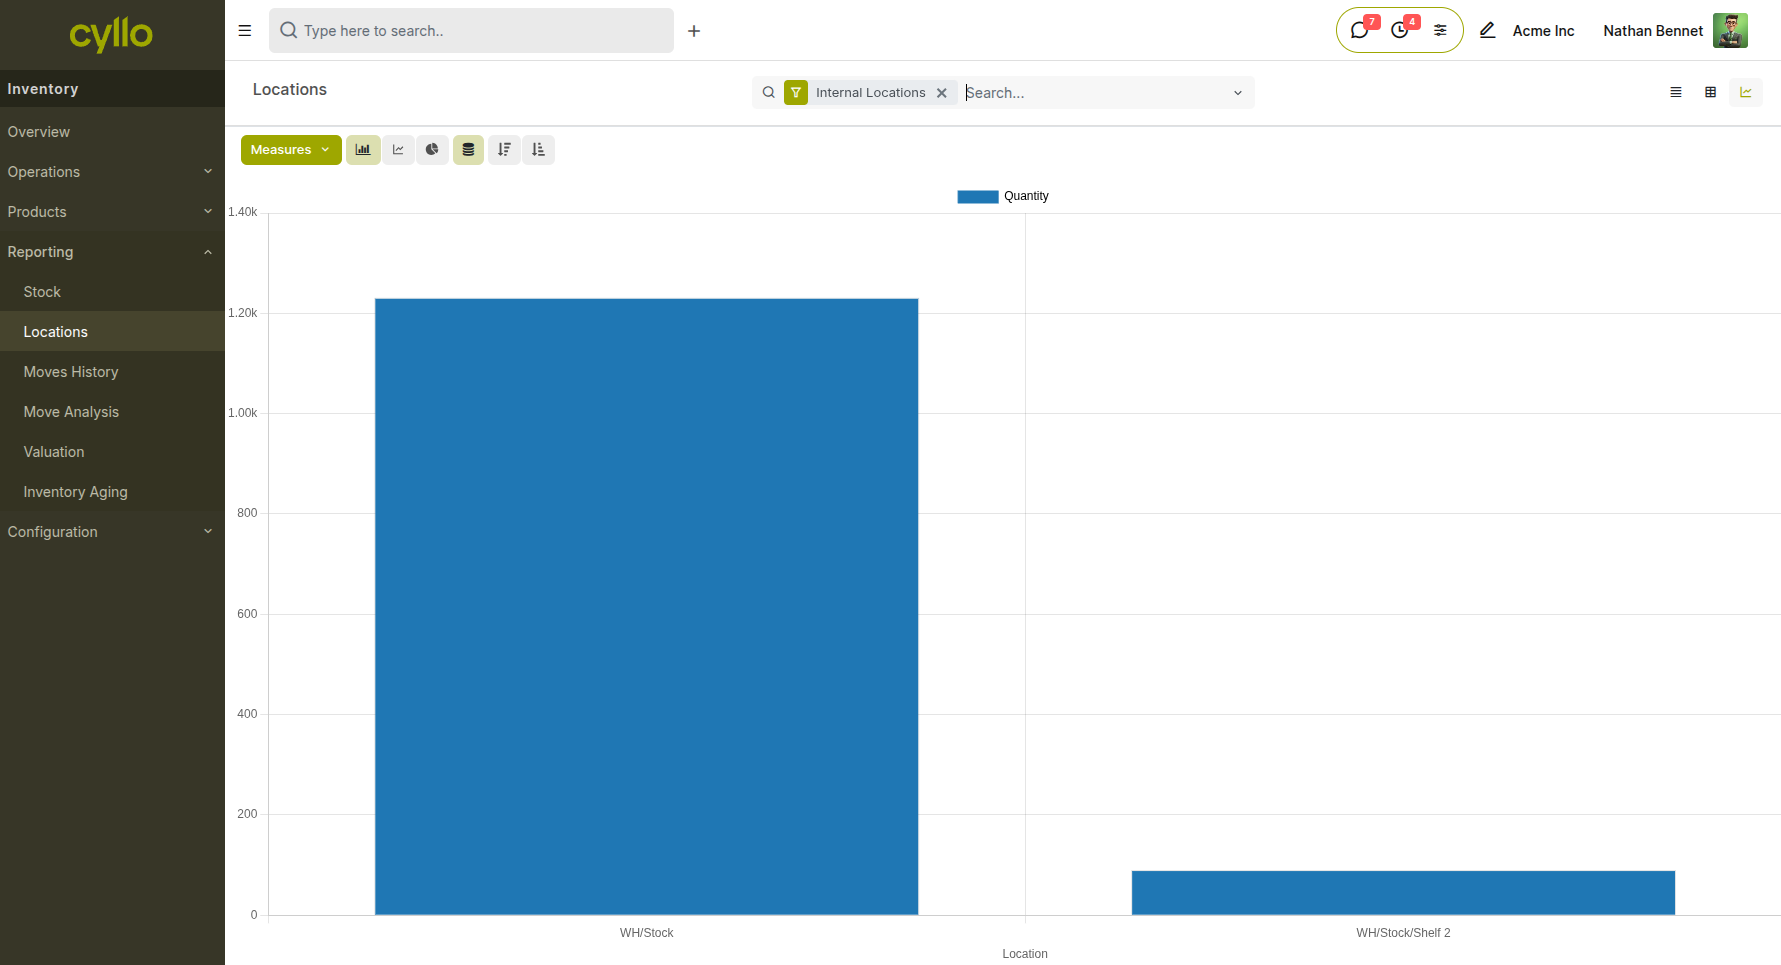
Fig 3.3 — Location report showing stock quantities per warehouse/location
How to access:
- Go to Inventory → Reporting → Locations
- Analyze stock stored in each location
3.4 Moves History Report
The Moves History report shows all stock movements, including receipts, deliveries, and internal transfers.
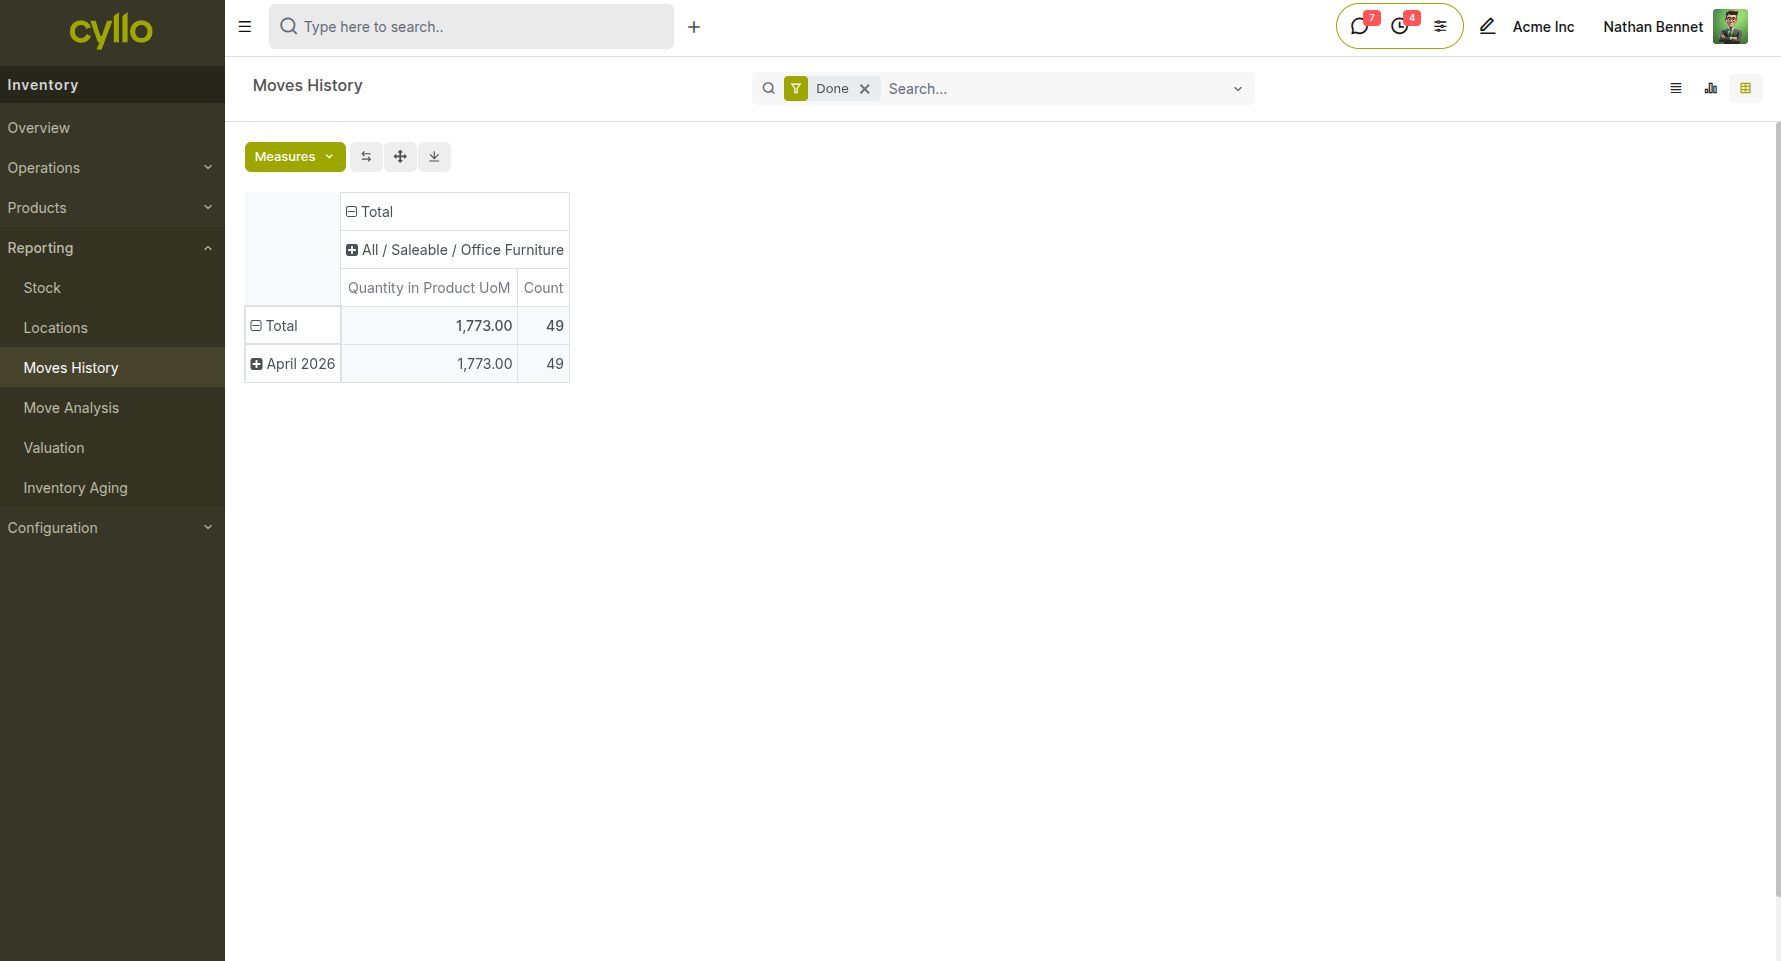
Fig 3.4 — Moves history showing stock movement records with dates and quantities
How to access:
- Go to Inventory → Reporting → Moves History
- Filter by date, product, or operation type
3.5 Inventory Aging Report
The Inventory Aging report helps identify how long products have been in stock, useful for detecting slow-moving or obsolete inventory.
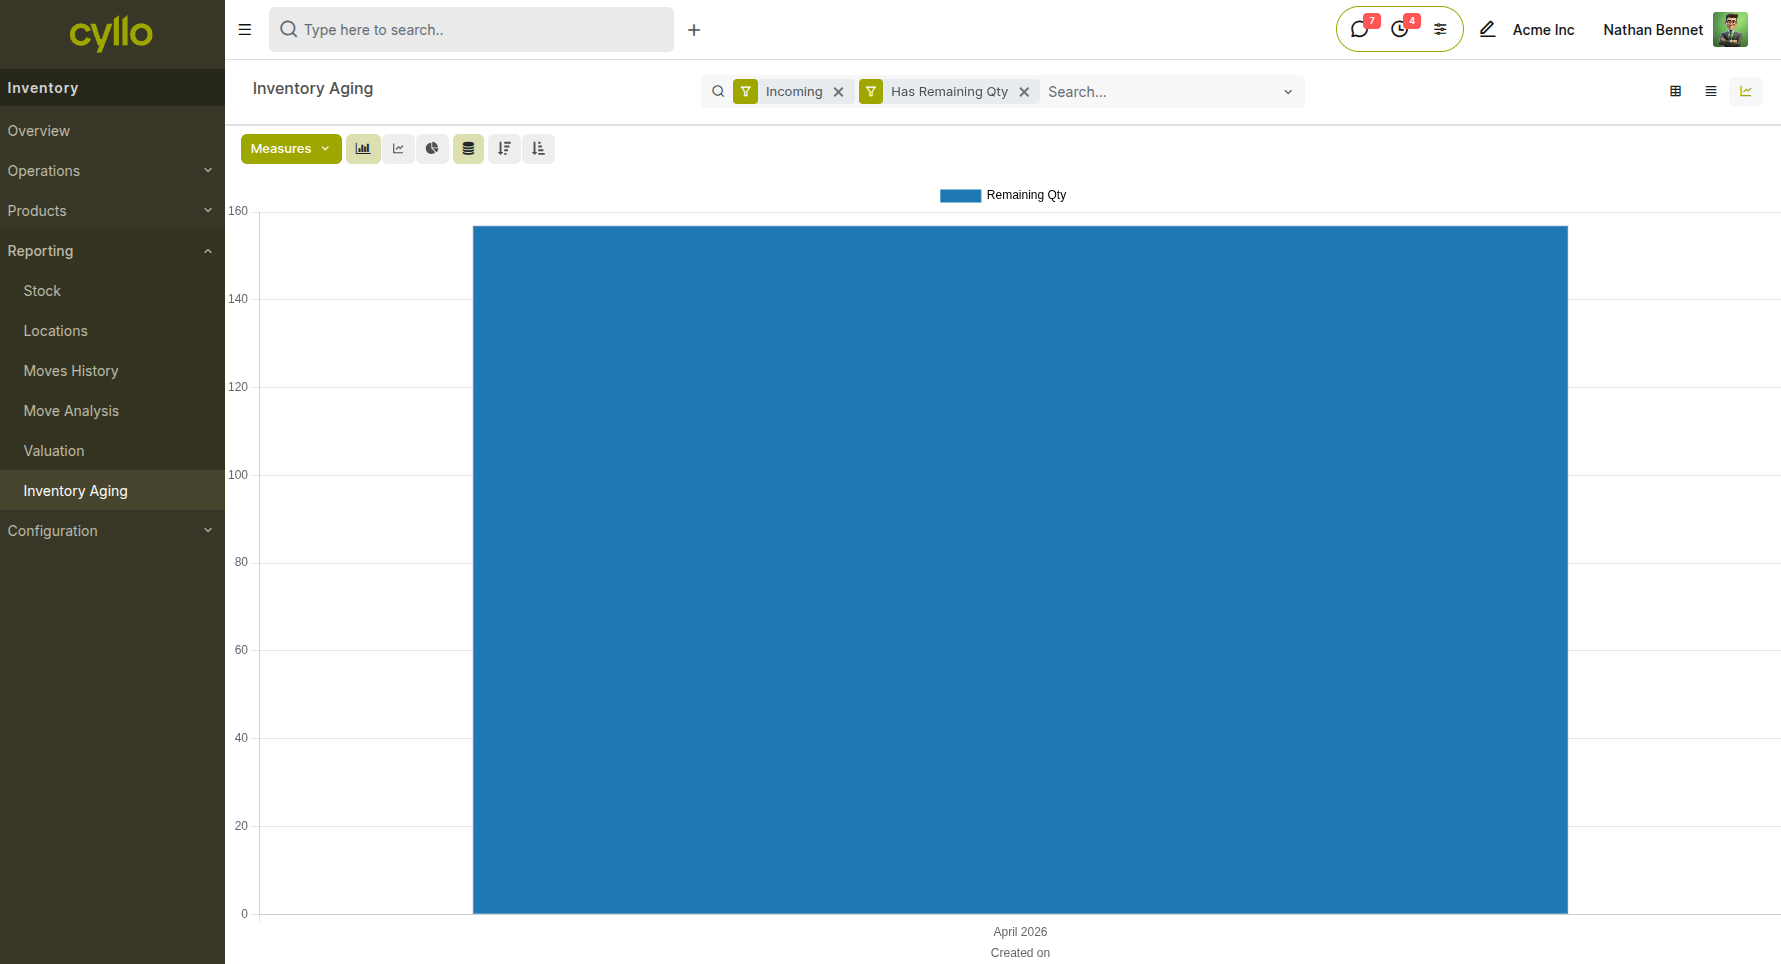
Fig 3.5 — Inventory aging report showing stock age distribution
How to access:
- Go to Inventory → Reporting → Inventory Aging
- Filter by product or category
4. Manufacturing Reports
The Manufacturing module provides reports for monitoring production efficiency, component usage, and quality control outcomes.
4.1 Overall Equipment Effectiveness
The Overall Equipment Effectiveness (OEE) report provides insights into manufacturing efficiency by measuring how effectively work centers are utilized. It helps track performance based on availability, productivity, and quality, enabling operations teams to identify inefficiencies and improve production performance.
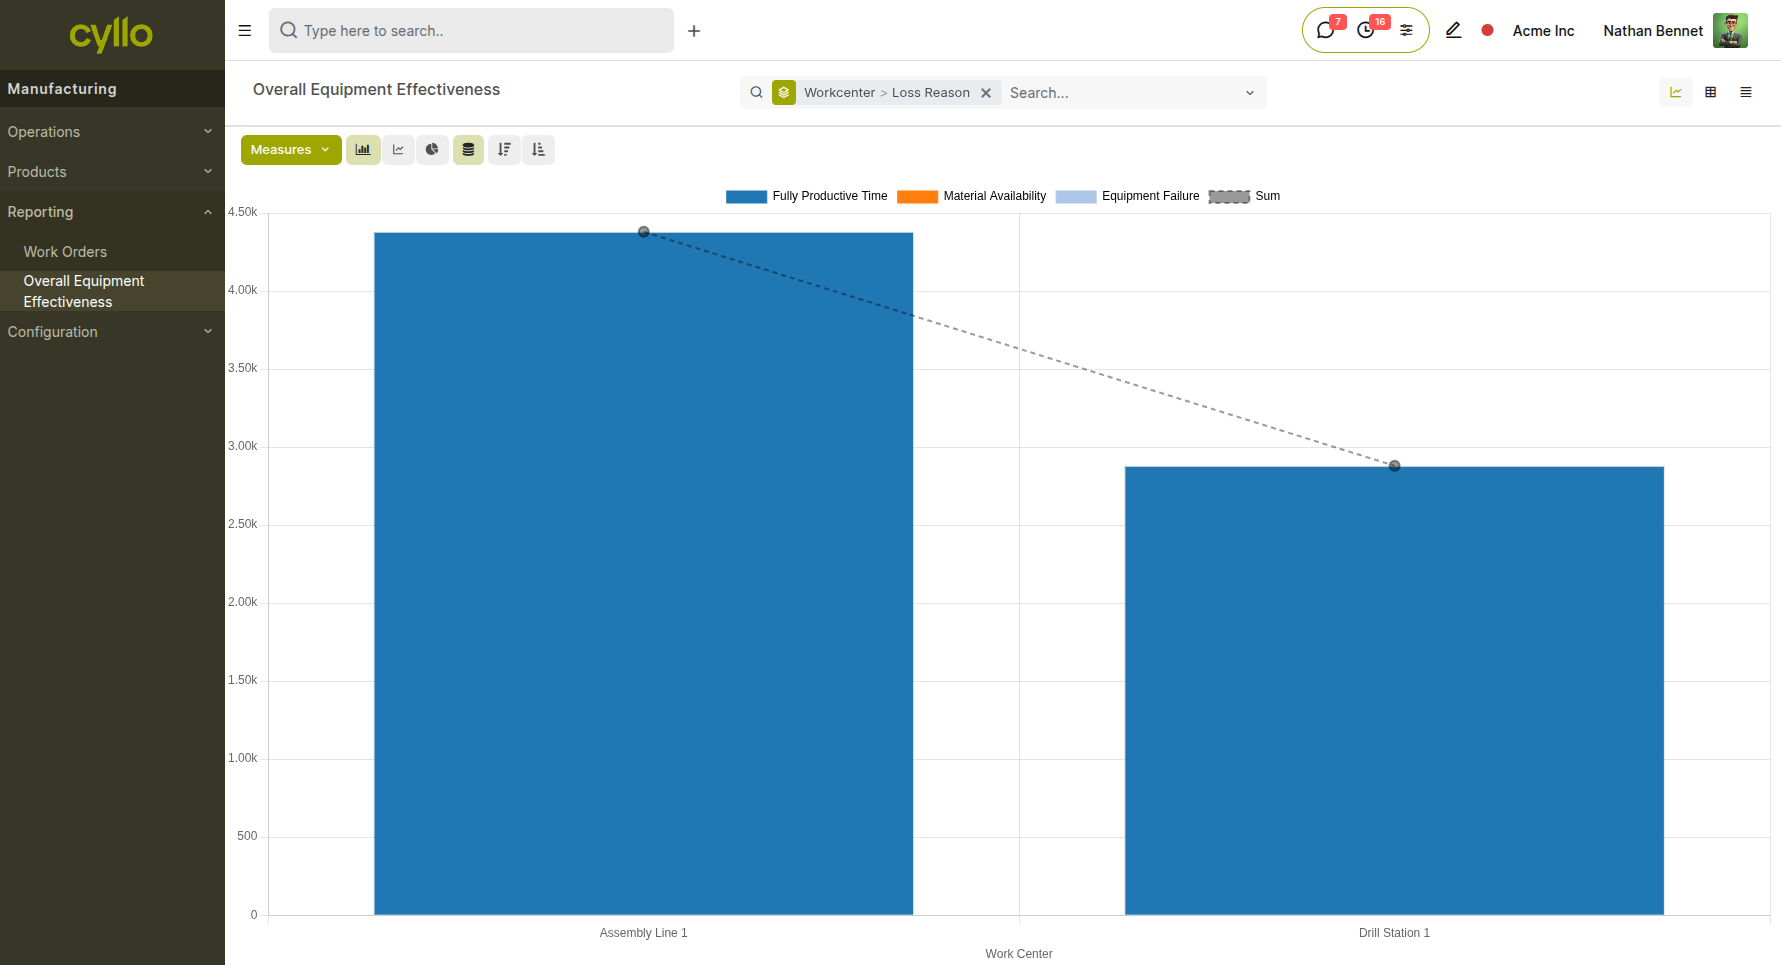
Fig 4.1 — Work Centers view used for analyzing Overall Equipment Effectiveness across different work centers
How to access Overall Equipment Effectiveness:
- Go to Manufacturing → Reporting → Overall Equipment Effectiveness
- Analyze performance by Work Center
- Use filters such as Date or Work Center to narrow the analysis
- Evaluate efficiency based on production time, downtime, and output
4.2 Scrap Analysis
The Scrap Analysis report tracks quantities and values of scrapped components and finished goods, with breakdown by product, scrap reason, and time period. This report is essential for quality control teams monitoring waste and production loss.
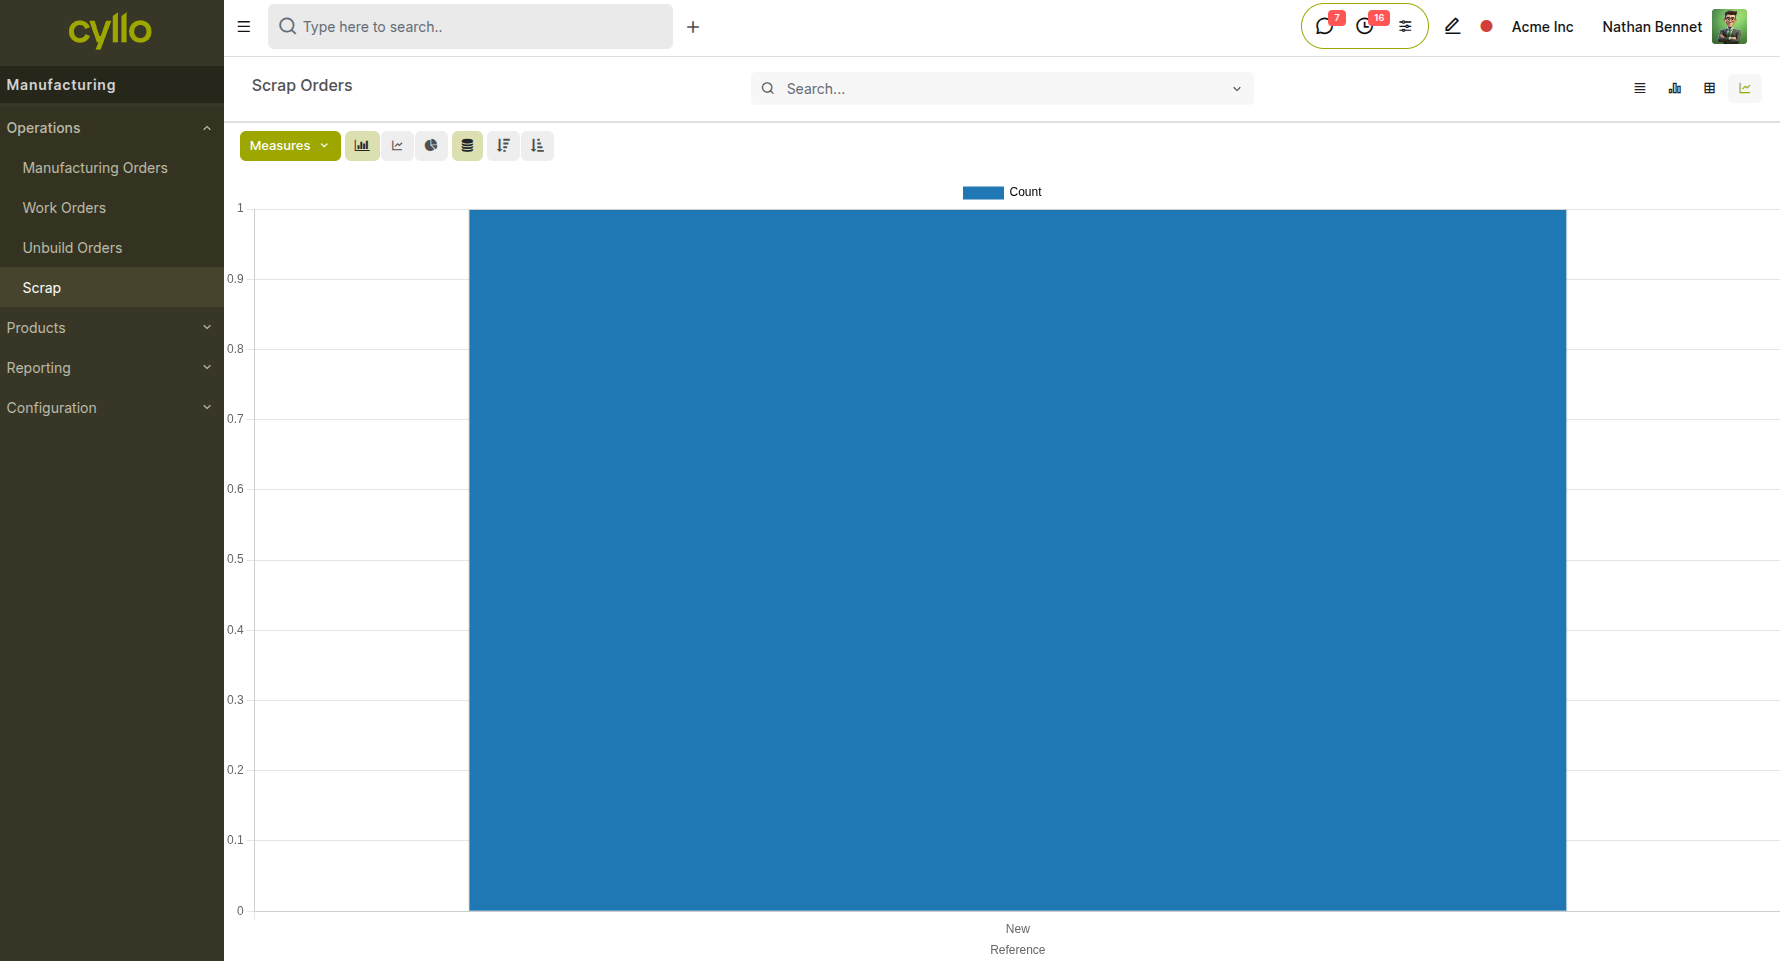
Fig 4.2 — Scrap Analysis report showing product, scrap quantity, scrap reason, and linked manufacturing order for each recorded scrap event
How to access Scrap Analysis:
- Go to Manufacturing → Operations→ Scrap
- Filter by date range, product, or scrap reason
- Use the Pivot view to compare scrap quantities across products and time periods
4.4 Allocation Report
The Allocation Report shows how finished product quantities from active Manufacturing Orders are allocated to specific sales orders. This report is available directly from the MO via the Allocation smart button once the feature is enabled in settings.
How to access the Allocation Report:
- Go to Manufacturing → Configuration → Settings and enable Allocation Report for Manufacturing Orders
- Open the relevant Manufacturing Order
- Click the Allocation smart button at the top of the MO form
5. Purchase Reports
The Purchase module provides reports covering procurement spend, vendor pricing, and order fulfillment.
5.1 Purchase Analysis
Purchase Analysis provides a breakdown of procurement spend by product, vendor, purchase team, or time period. It is the primary report for monitoring purchasing costs and identifying spending patterns.
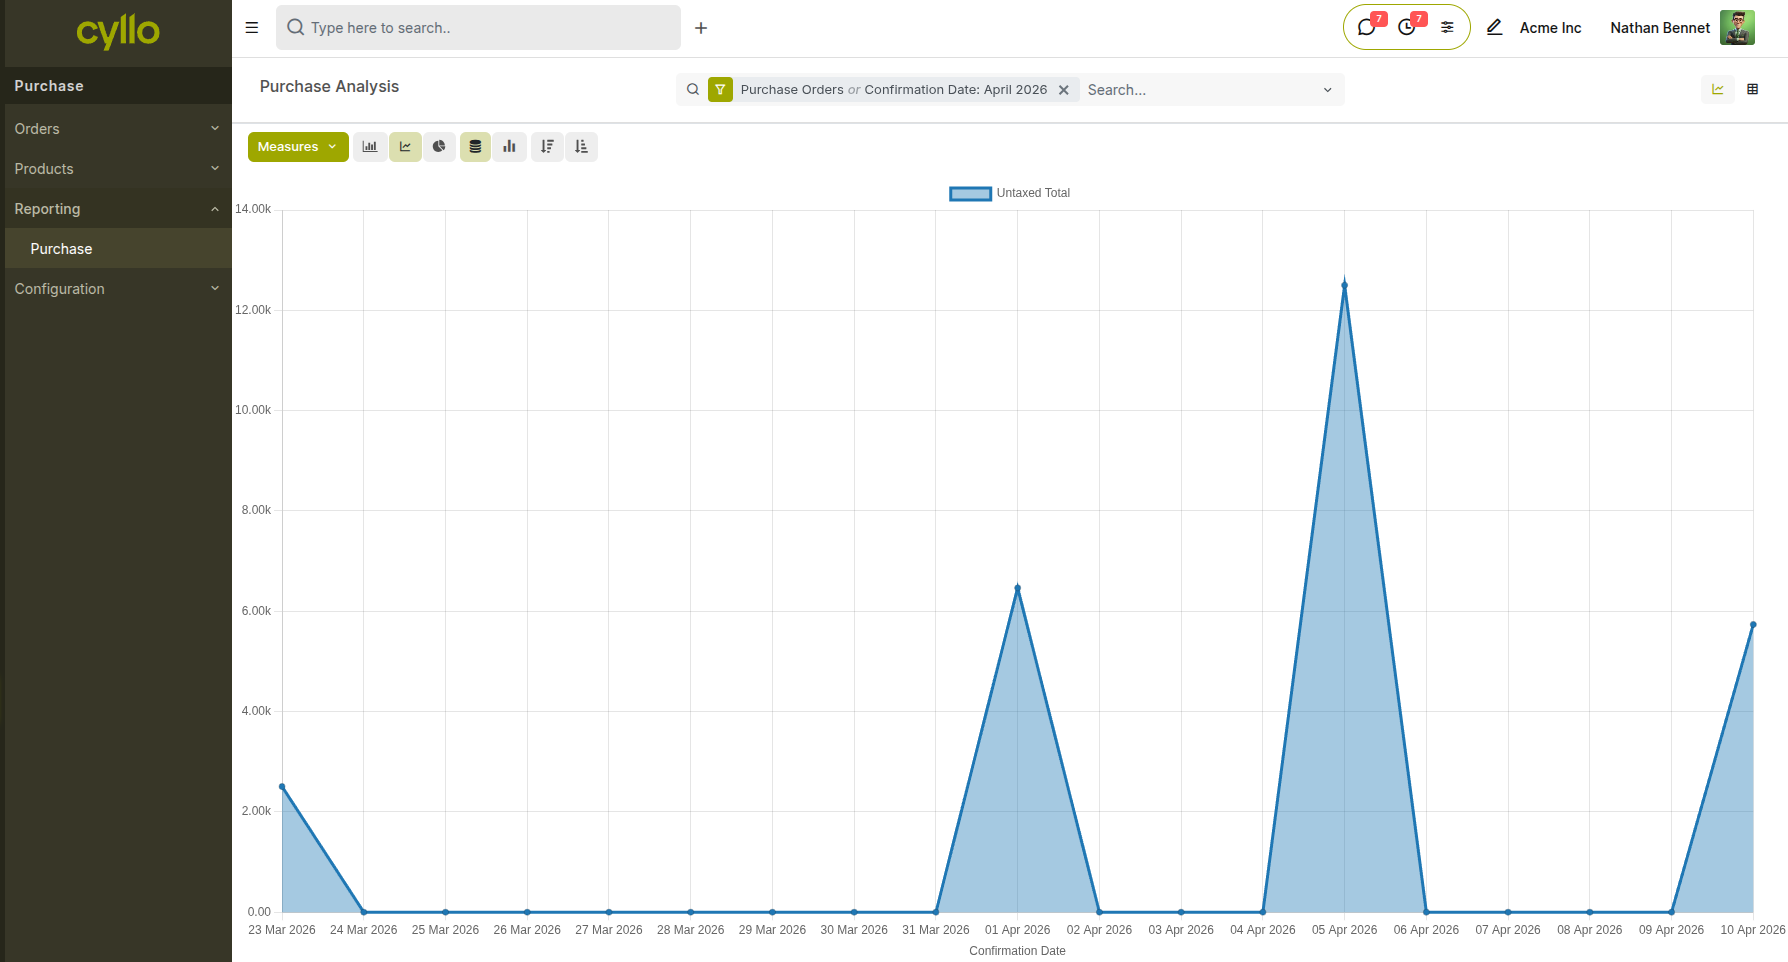
Fig 5.1 — Purchase Analysis report in graph view
How to access Purchase Analysis:
- Go to Purchase → Reporting → Purchase Analysis
- Group by Vendor, Product Category, or Purchase Representative
- Filter by Order Date or Status (Draft RFQ, Purchase Order, Done)
- Switch to Graph view for a visual breakdown of spend by vendor or category over time
5.2 Vendor Performance
The vendor list and RFQ history together provide an operational view of vendor performance — comparing response times, pricing across multiple RFQs, and delivery reliability. Vendor pricelists and blanket order history can also be reviewed from within each vendor record.
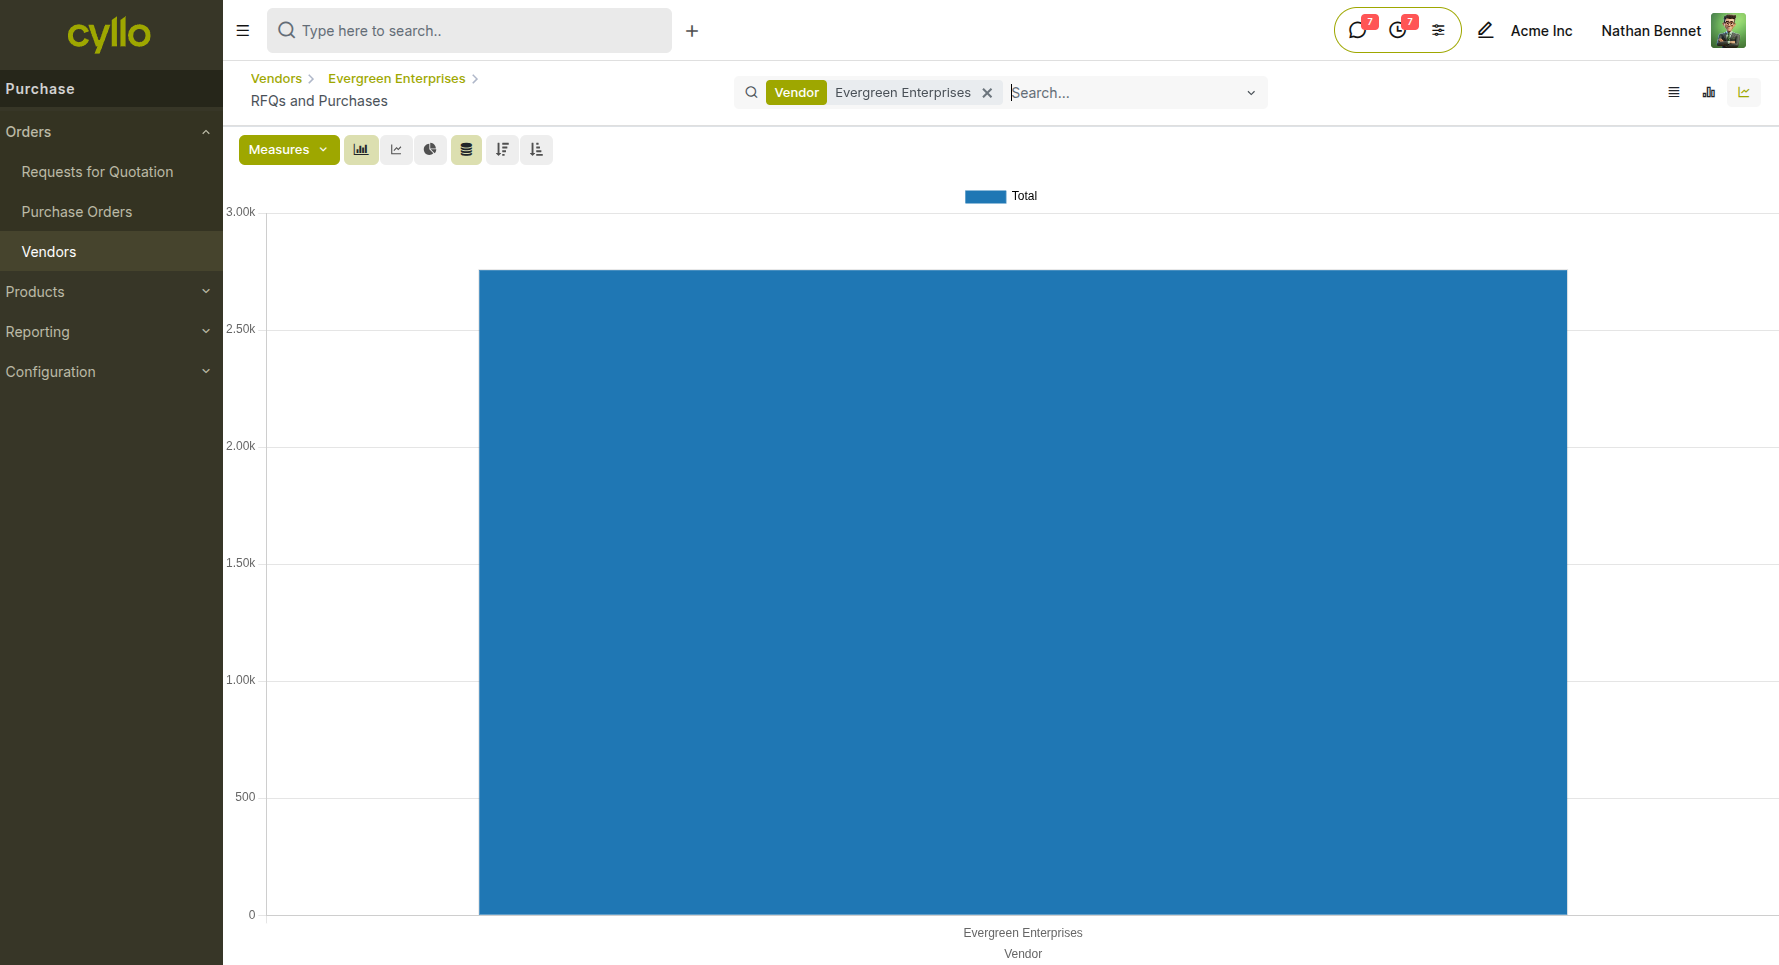
Fig 5.2 — Vendor record showing purchase history smart button count and linked RFQs and POs with status and value
Vendor record showing purchase history smart button count and linked RFQs and POs with status and value
How to review vendor performance:
- Go to Purchase → Orders → Vendors
- Open the vendor record and click the Purchases smart button to view order history
- Review pricing trends across multiple orders using the Purchase Analysis report filtered by the specific vendor
6. Accounting Reports
The Accounting module provides the full suite of financial reports required for period-end close, compliance, and management reporting.
6.1 Profit and Loss
The Profit and Loss (P&L) report shows revenue, cost of goods sold, gross profit, operating expenses, and net profit for any selected period. It supports comparison across multiple periods and can be filtered by analytic account for department-level P&L views.
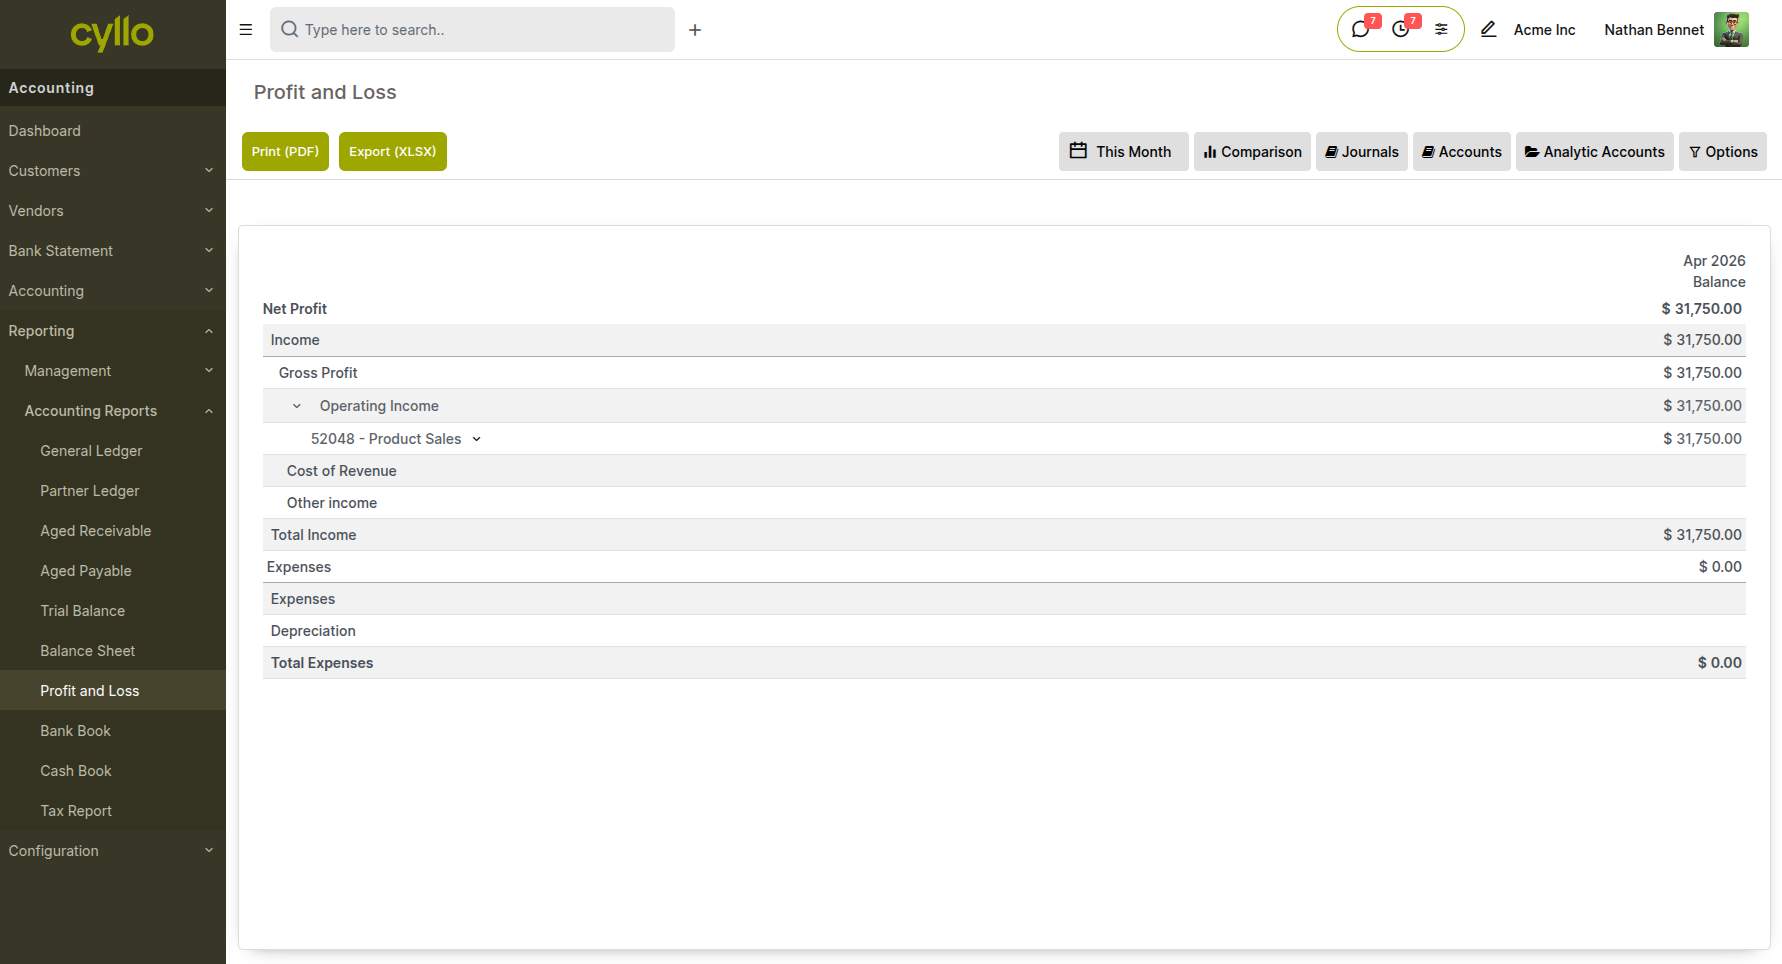
Fig 6.1 — Profit and Loss report showing income, cost of revenue, gross profit, operating expenses, and net profit for the selected date range with comparison column
How to access the Profit and Loss report:
- Go to Accounting → Reporting → Profit and Loss
- Set the date range using the period filter at the top
- Enable the comparison toggle to show the previous period or previous year alongside the current period
- Export to PDF or XLSX using the print/export buttons
6.2 Balance Sheet
The Balance Sheet report shows the financial position of the company at a point in time — assets, liabilities, and equity. It is generated directly from the posted journal entries in the accounting ledger and reflects the real-time state of all accounts.
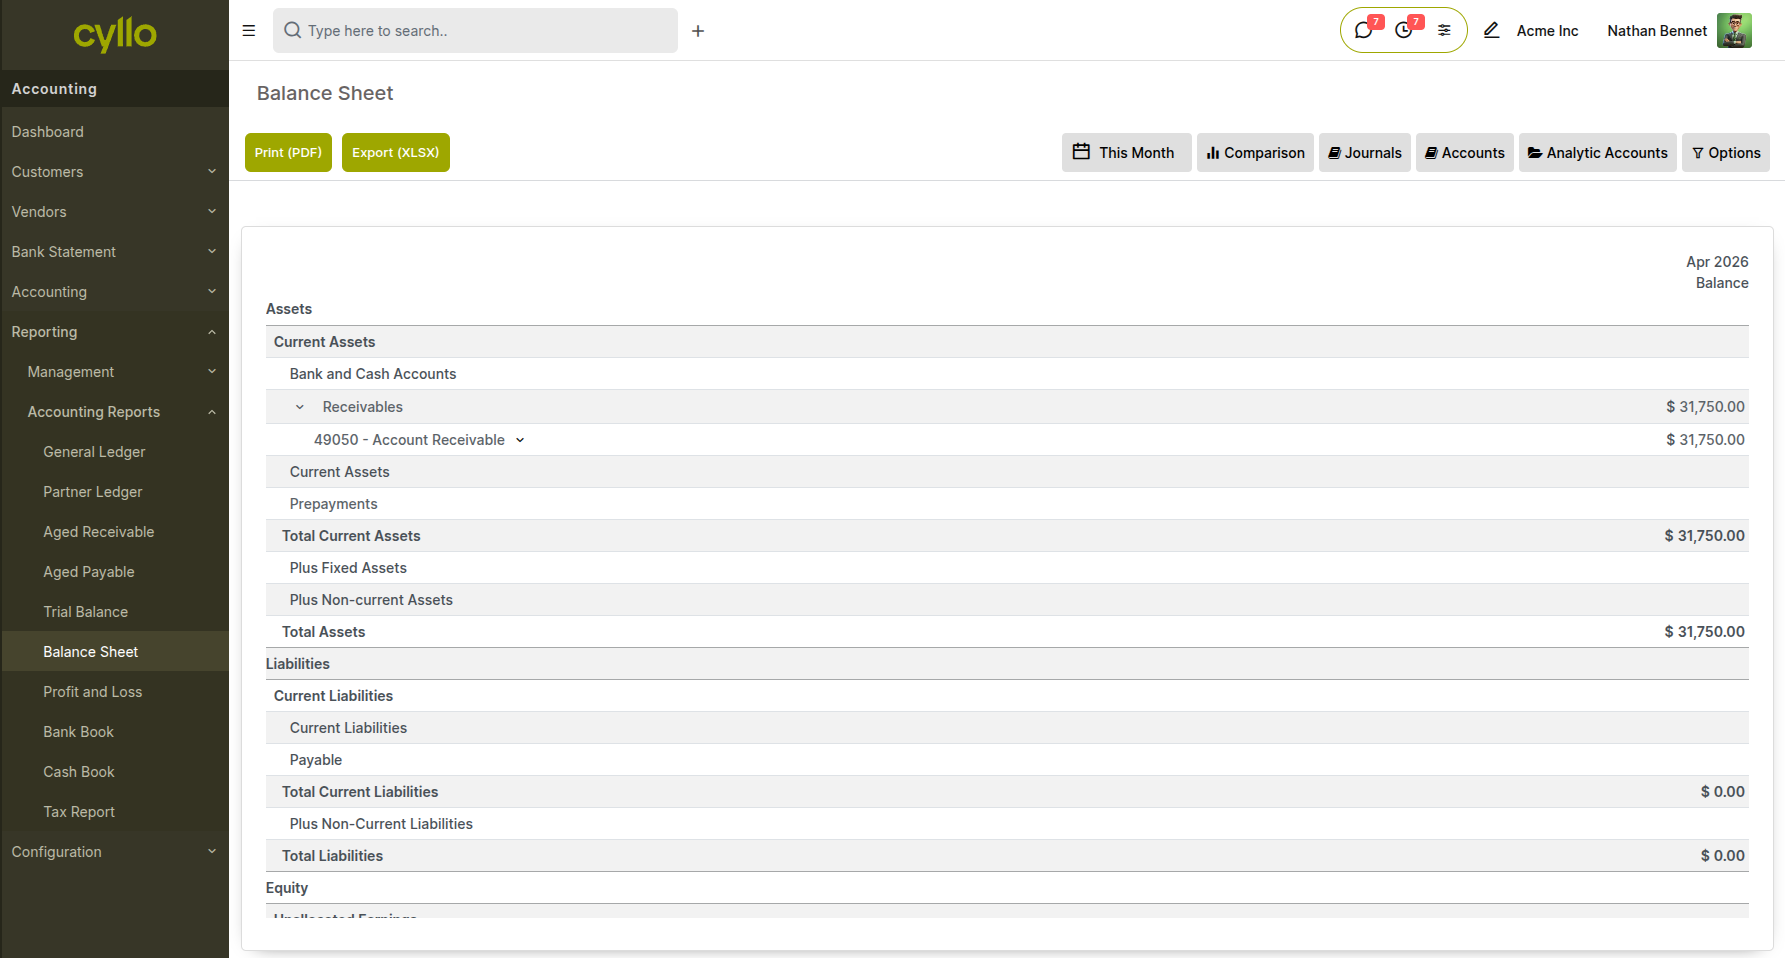
Fig 6.2 — Balance Sheet report showing Assets section (current and non-current), Liabilities section, and Equity section with totals
How to access the Balance Sheet:
- Go to Accounting → Reporting → Balance Sheet
- Set the as-of date to the reporting period end
- Use the comparison option to show the prior year balance sheet alongside
6.3 General Ledger
The General Ledger report shows every journal entry posted in the system, organized by account. It is the most detailed accounting report — used for audit trails, account reconciliation, and investigating specific transactions.
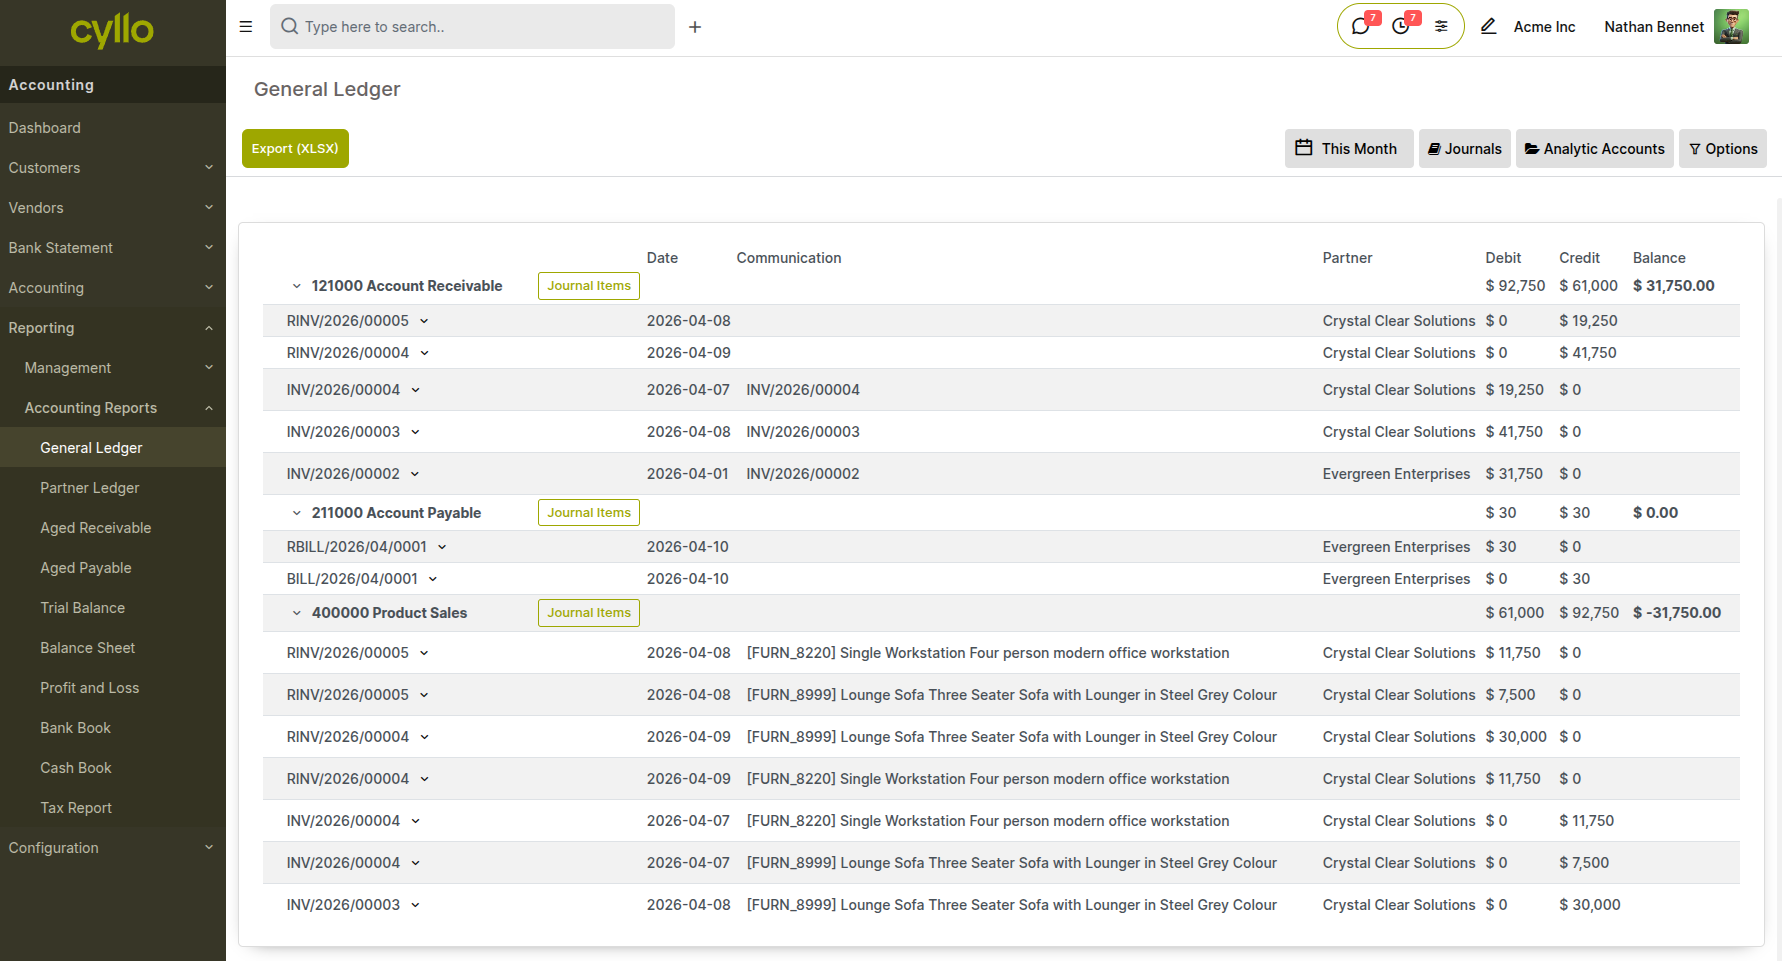
Fig 6.3 — General Ledger report showing account code, account name, journal entries listed by date with debit, credit, and running balance columns
How to access the General Ledger:
- Go to Accounting → Reporting → General Ledger
- Filter by account, journal, or date range
- Click any journal entry line to open the source document (invoice, payment, or manual entry)
6.4 Aged Receivable and Aged Payable
The Aged Receivable report shows outstanding customer invoices grouped by aging bucket (current, 0–30 days overdue, 31–60 days, 61–90 days, 90+ days). The Aged Payable report does the same for outstanding vendor bills. Both reports are essential for cash flow management and collections prioritization.

Fig 6.4 — Aged Receivable report showing customer names across aging columns with total outstanding amounts per bucket and grand total
How to access these reports:
- Go to Accounting → Reporting → Aged Receivable (or Aged Payable)
- Set the as-of date — the report calculates aging relative to this date
- Click any customer row to drill into the specific open invoices in that aging bucket
- Export to XLSX to share with the collections team
6.5 Trial Balance
The Trial Balance lists all accounts with their debit and credit balances, ensuring that total debits equal total credits.
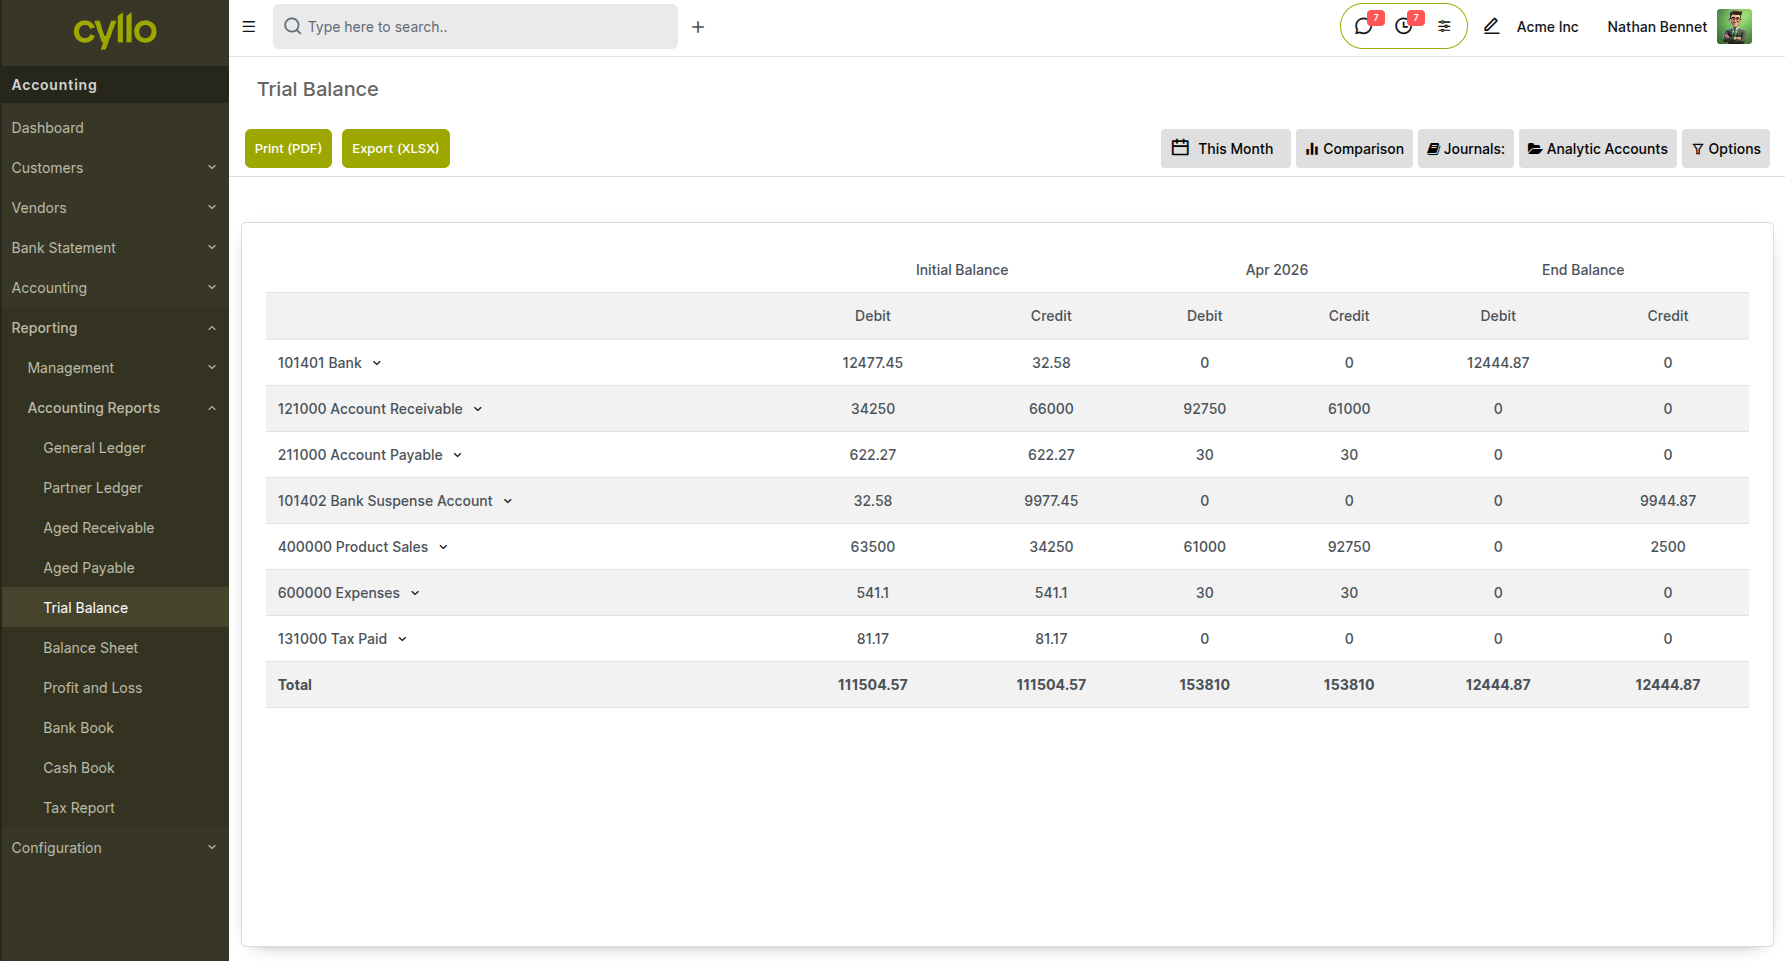
Fig 6.5 — Trial Balance showing account-wise debit and credit balances
How to access:
- Go to Accounting → Reporting → Trial Balance
- Set the reporting period
- Use it for reconciliation and audit checks
6.6 Partner Ledger
The Partner Ledger shows transactions and balances for each customer or vendor, helping track receivables and payables per partner.
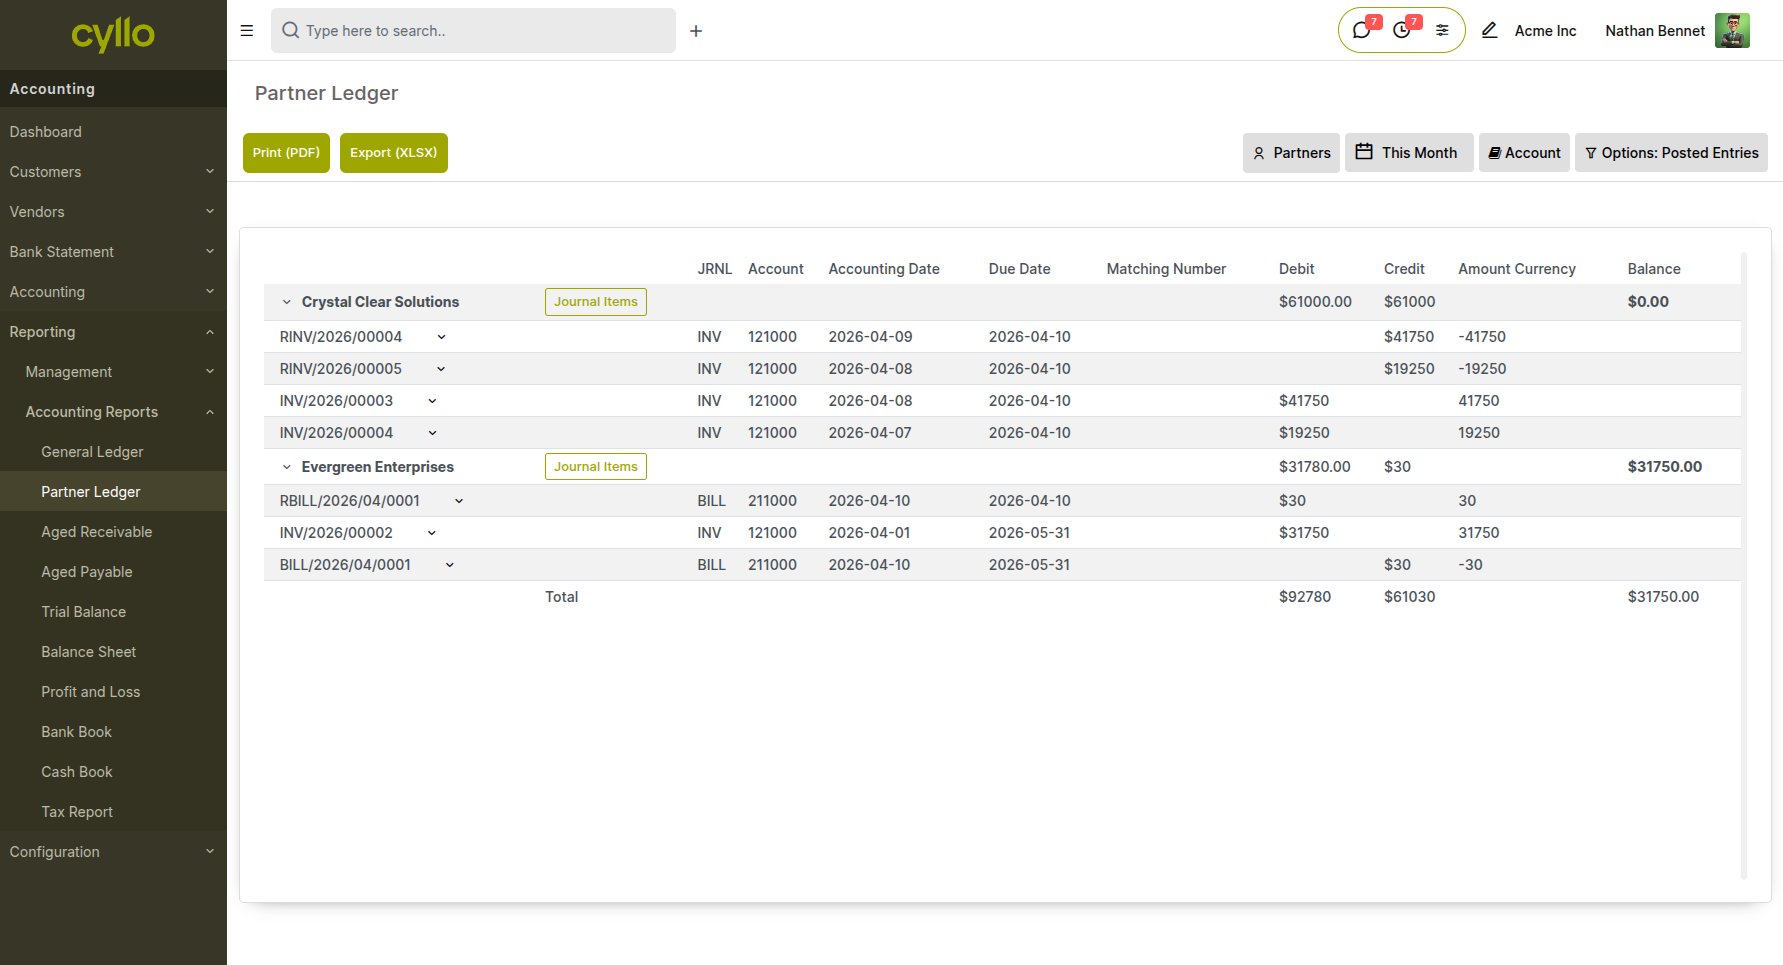
Fig 6.6 — Partner Ledger showing transactions grouped by customer/vendor with balances
How to access:
- Go to Accounting → Reporting → Partner Ledger
- Filter by customer or vendor
- Analyze outstanding balances
6.7 Invoice Analysis Report
The Invoice Analysis report provides a visual and analytical view of invoiced amounts over time. It helps track revenue trends, customer invoicing patterns, and overall billing performance.
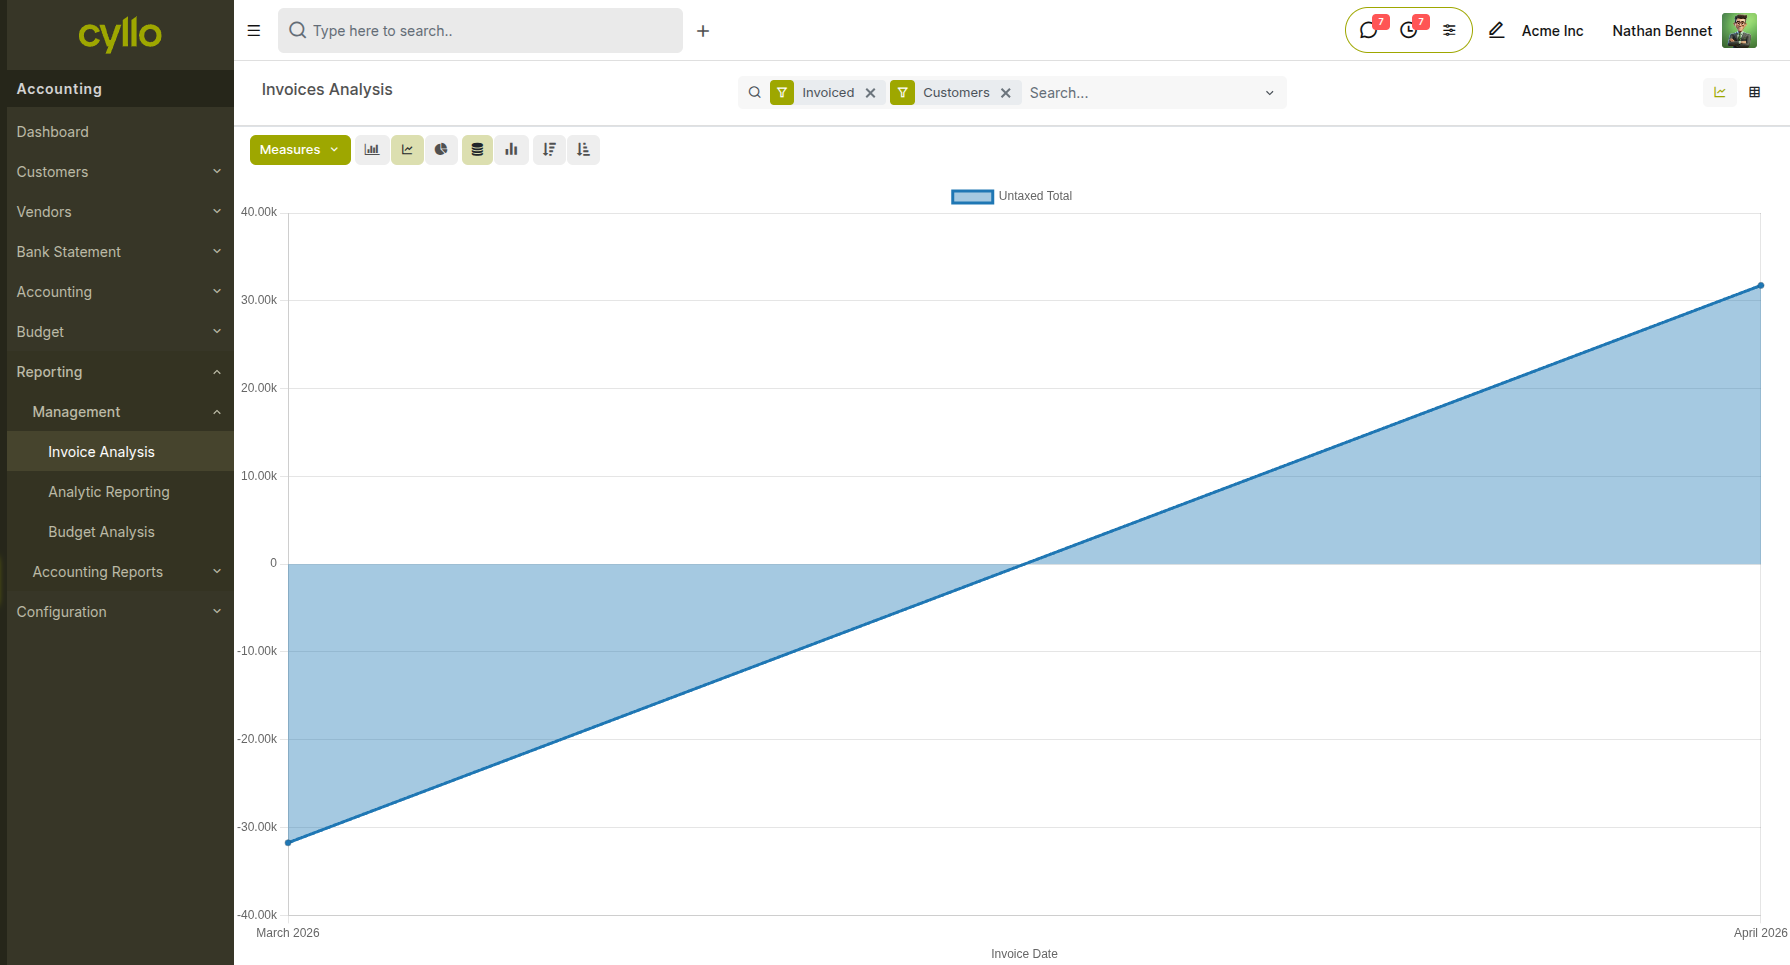
Fig 6.7 — Invoice Analysis report showing invoiced amounts over time in graph view
How to access:
- Go to Accounting → Reporting → Management → Invoice Analysis
- Apply filters such as Date, Customer, or Invoice Status
- Use Graph or Pivot view to analyze trends
6.8 Analytic Reporting
Analytic Reporting provides insights based on analytic accounts, allowing tracking of costs and revenues by department, project, or business unit.
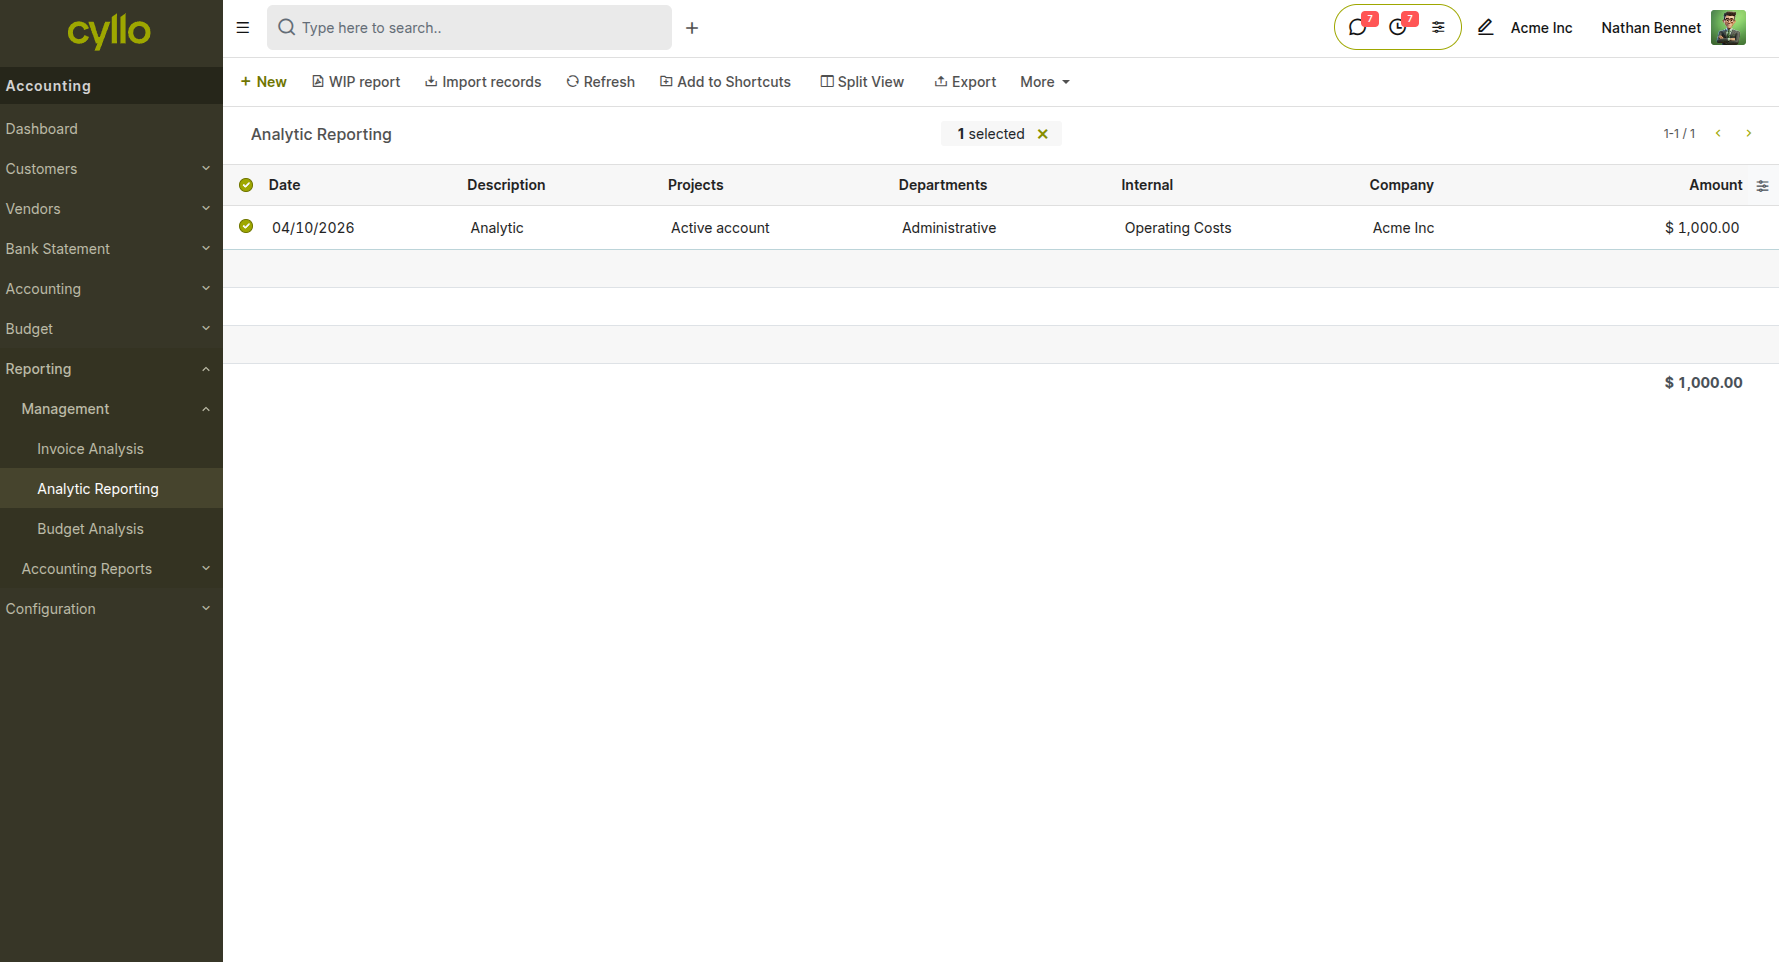
Fig 6.8 — Analytic report showing revenue and expenses grouped by analytic account
How to access:
- Go to Accounting → Reporting → Management → Analytic Reporting
- Filter by analytic account or date range
- Analyze performance across departments or projects
6.9 Budget Analysis
The Budget Analysis report compares planned budgets with actual financial data, helping monitor budget performance.
How to access:
- Go to Accounting → Reporting → Management → Budget Analysis
- Filter by budget period or analytic account
Note
This report is available only if the Budget module is configured.
6.10 Additional Reports
Other available reports include:
- Bank Book → Tracks bank transactions
- Cash Book → Tracks cash transactions
- Tax Report → Displays tax-related data for compliance
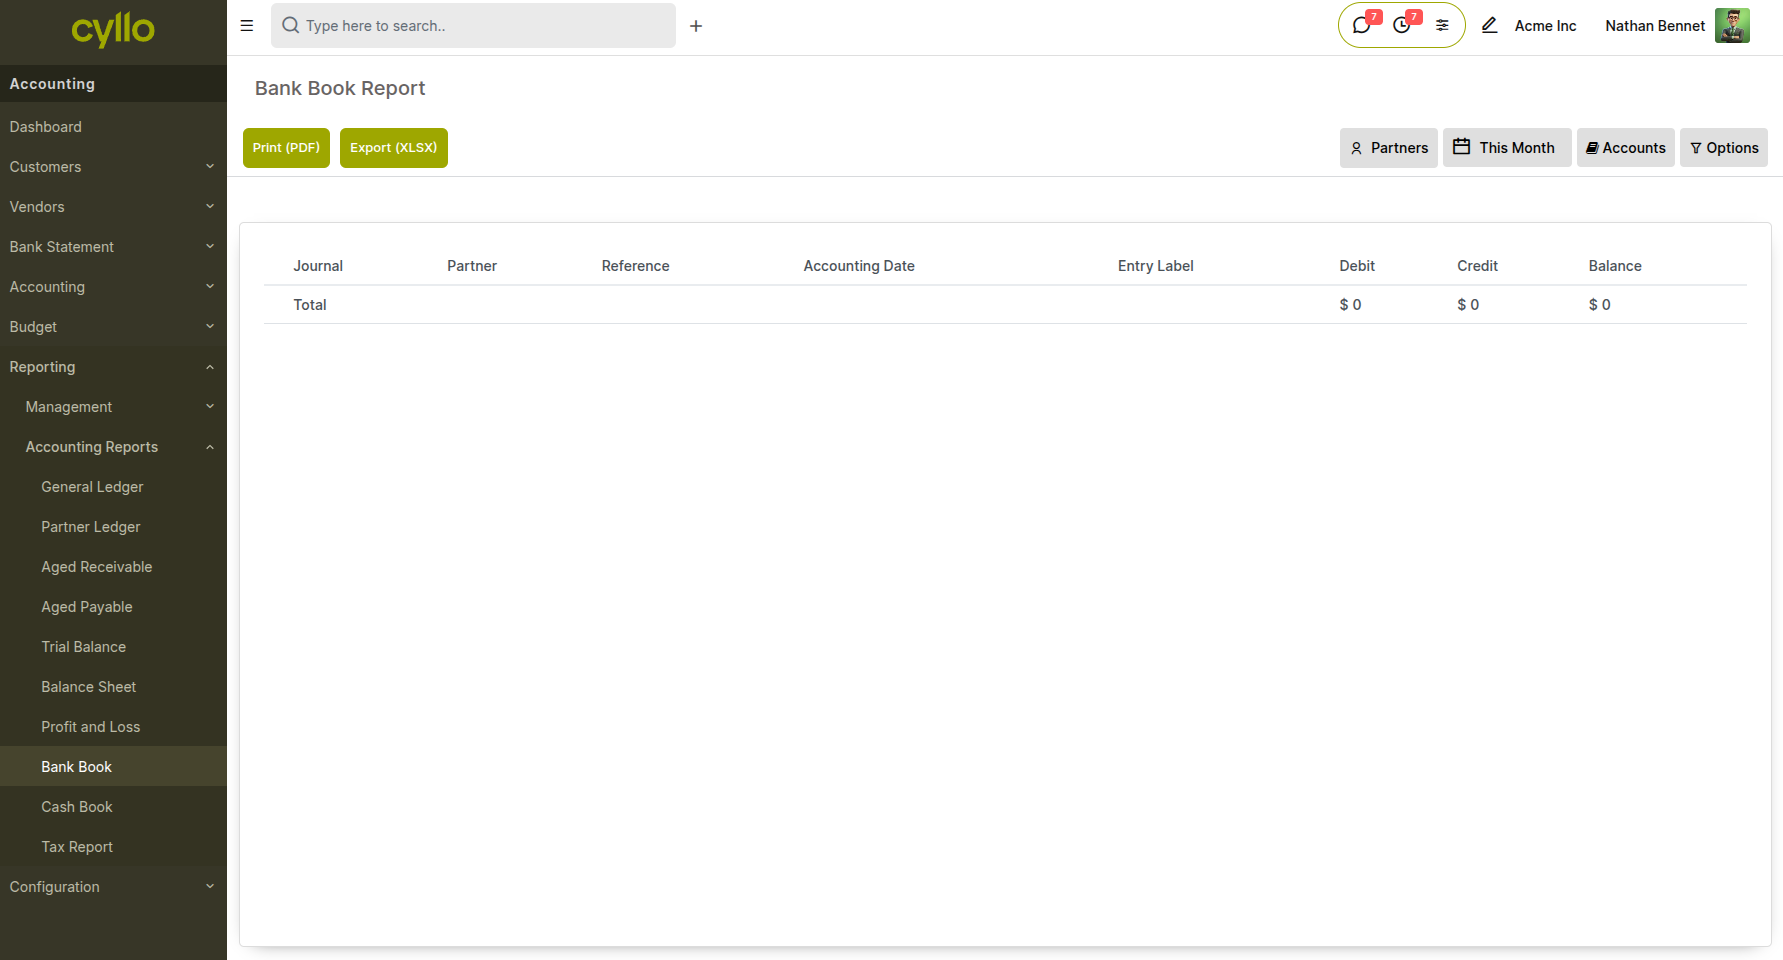
Fig 6.9 — Bank book report
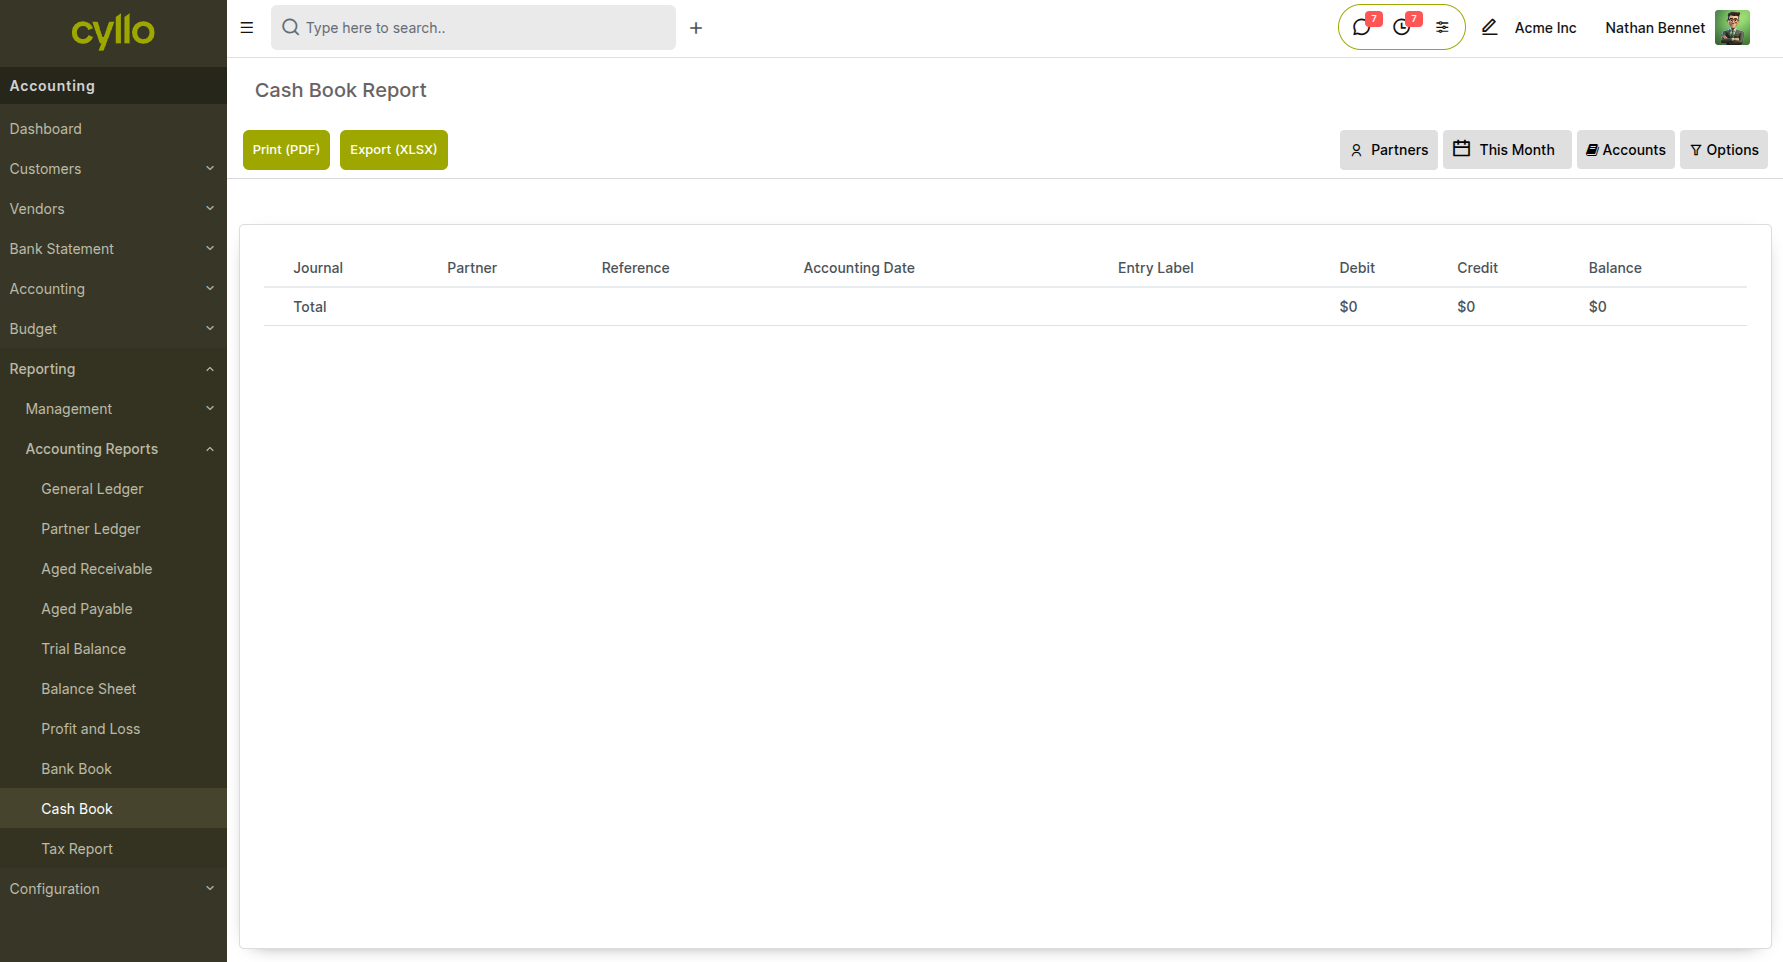
Fig 6.10 — Cash Book report
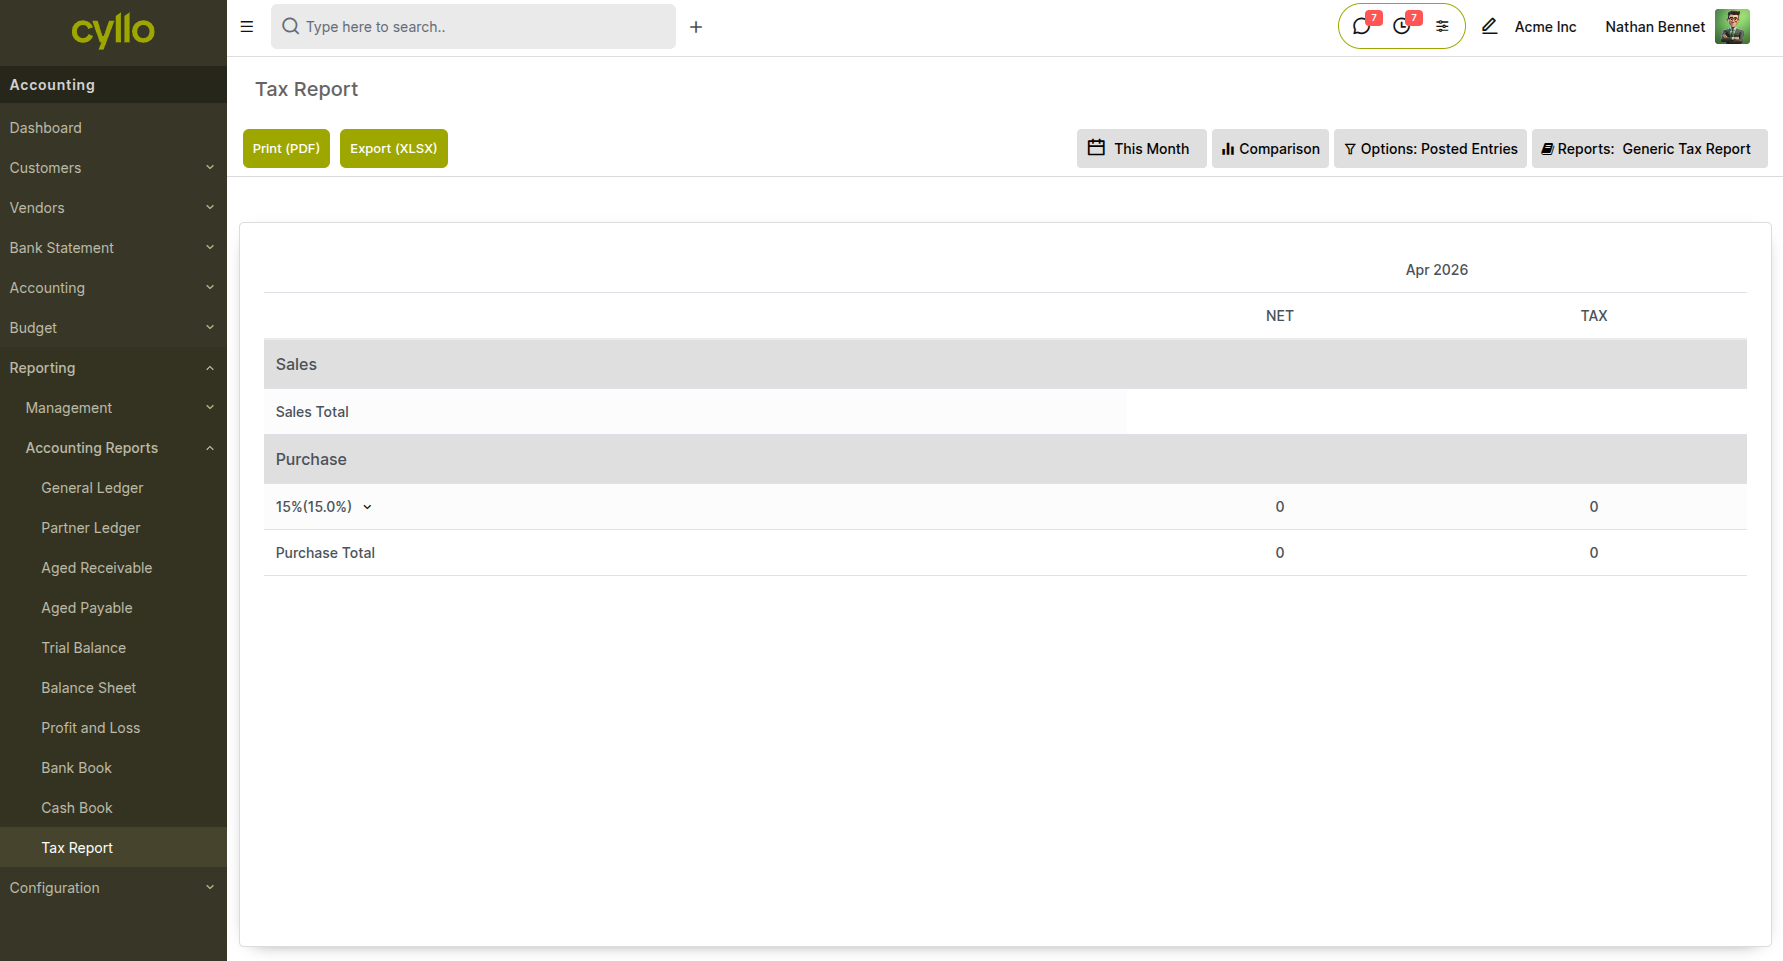
Fig 6.11 — Example financial report showing transaction summaries
7. HR and Payroll Reports
The HR and Payroll modules provide reports covering employee compensation, attendance, leave usage, and time tracking.
7.1 Payslip Reports
Payslip Reports provide a detailed view of payroll runs — showing gross pay, deductions, net pay, and salary rule breakdown per employee and per payroll period. Batch payslip reports cover all employees in a single payroll run.
Fig 7.1 — Payslip report for an individual employee showing salary structure lines — basic salary, allowances, deductions, and net pay — for the current period
How to access Payslip Reports:
- Go to Payroll → Payslips → All Payslips
- Filter by employee, department, or pay period
- Open any payslip and click Print to generate the individual payslip PDF
- For batch reporting, go to Payroll → Payslips → Batches and open the relevant batch to view or print all payslips in that run
7.2 Attendance Reports
The Attendance Report shows check-in and check-out records per employee, along with total hours worked per day. It is used for payroll validation, overtime tracking, and monitoring punctuality.
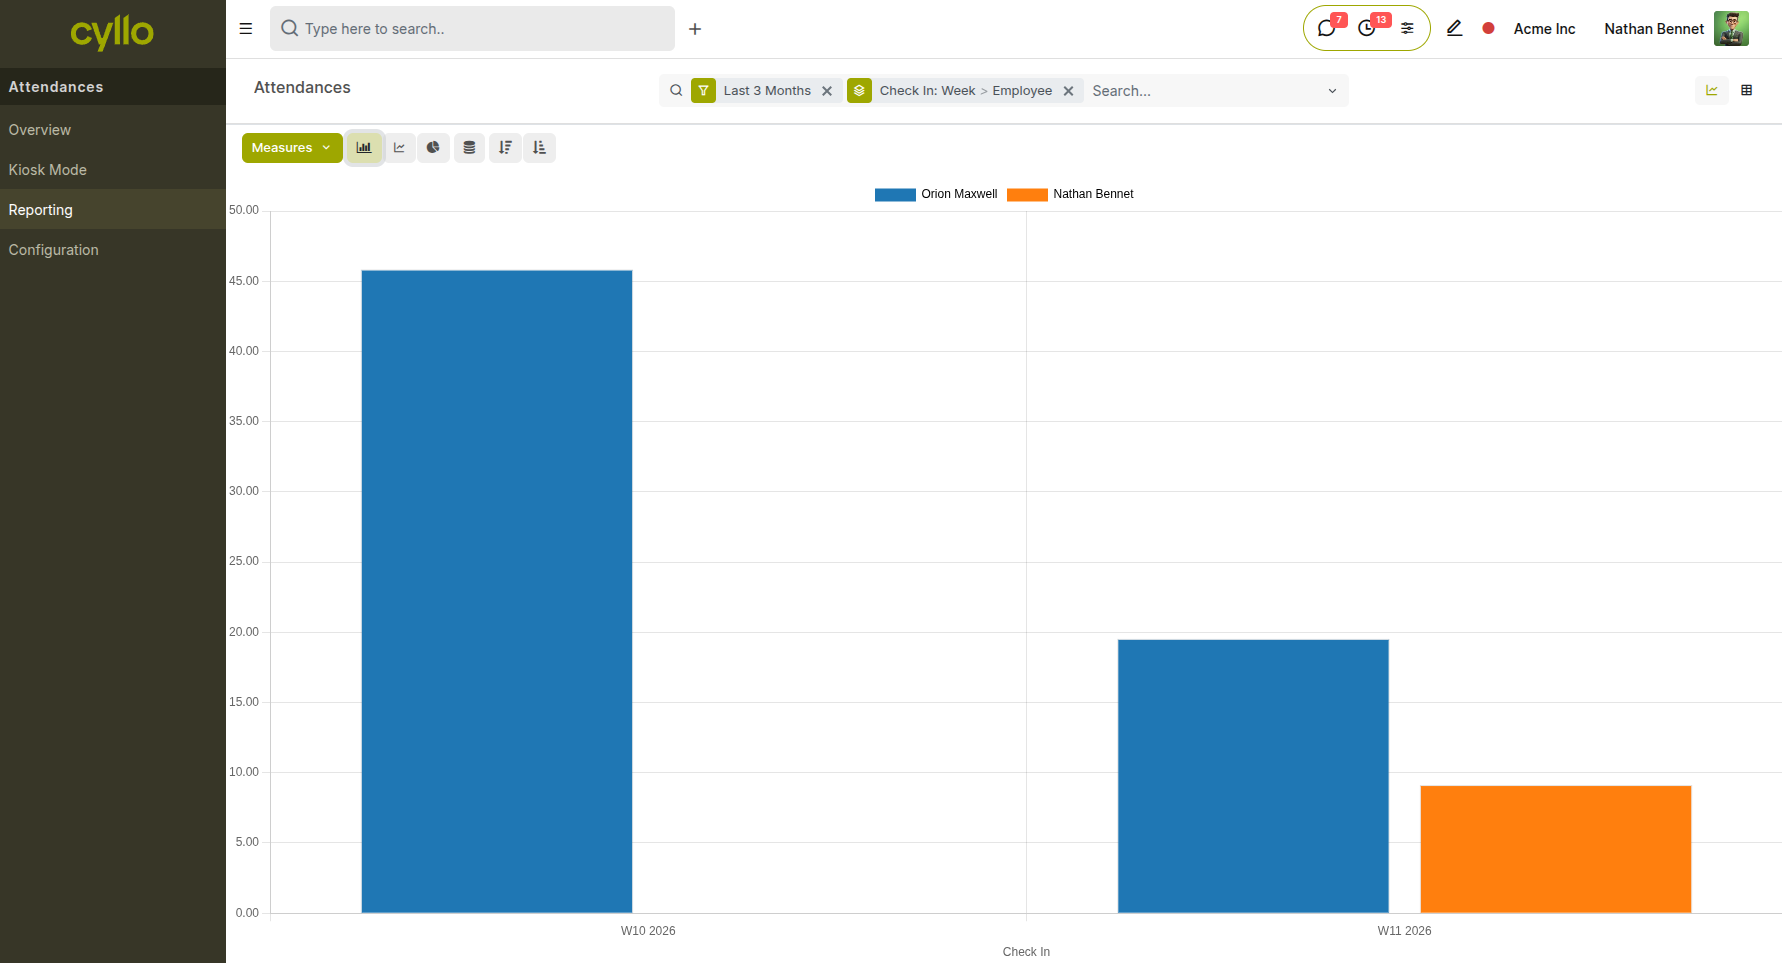
Fig 7.2 — Attendance Report in graph view showing weekly check-in time of employees
How to access Attendance Reports:
- Go to Attendances → Reporting → Attendance
- Filter by employee, department, or date range
- Switch to Pivot view to see total hours worked per employee across a week or month
- Use the Graph view for a visual trend of attendance patterns over time
7.3 Leave Analysis
The Leave Analysis report provides a breakdown of leave taken and remaining allocations per employee, leave type, and department. It helps HR managers monitor leave usage patterns and identify teams with high absence rates.
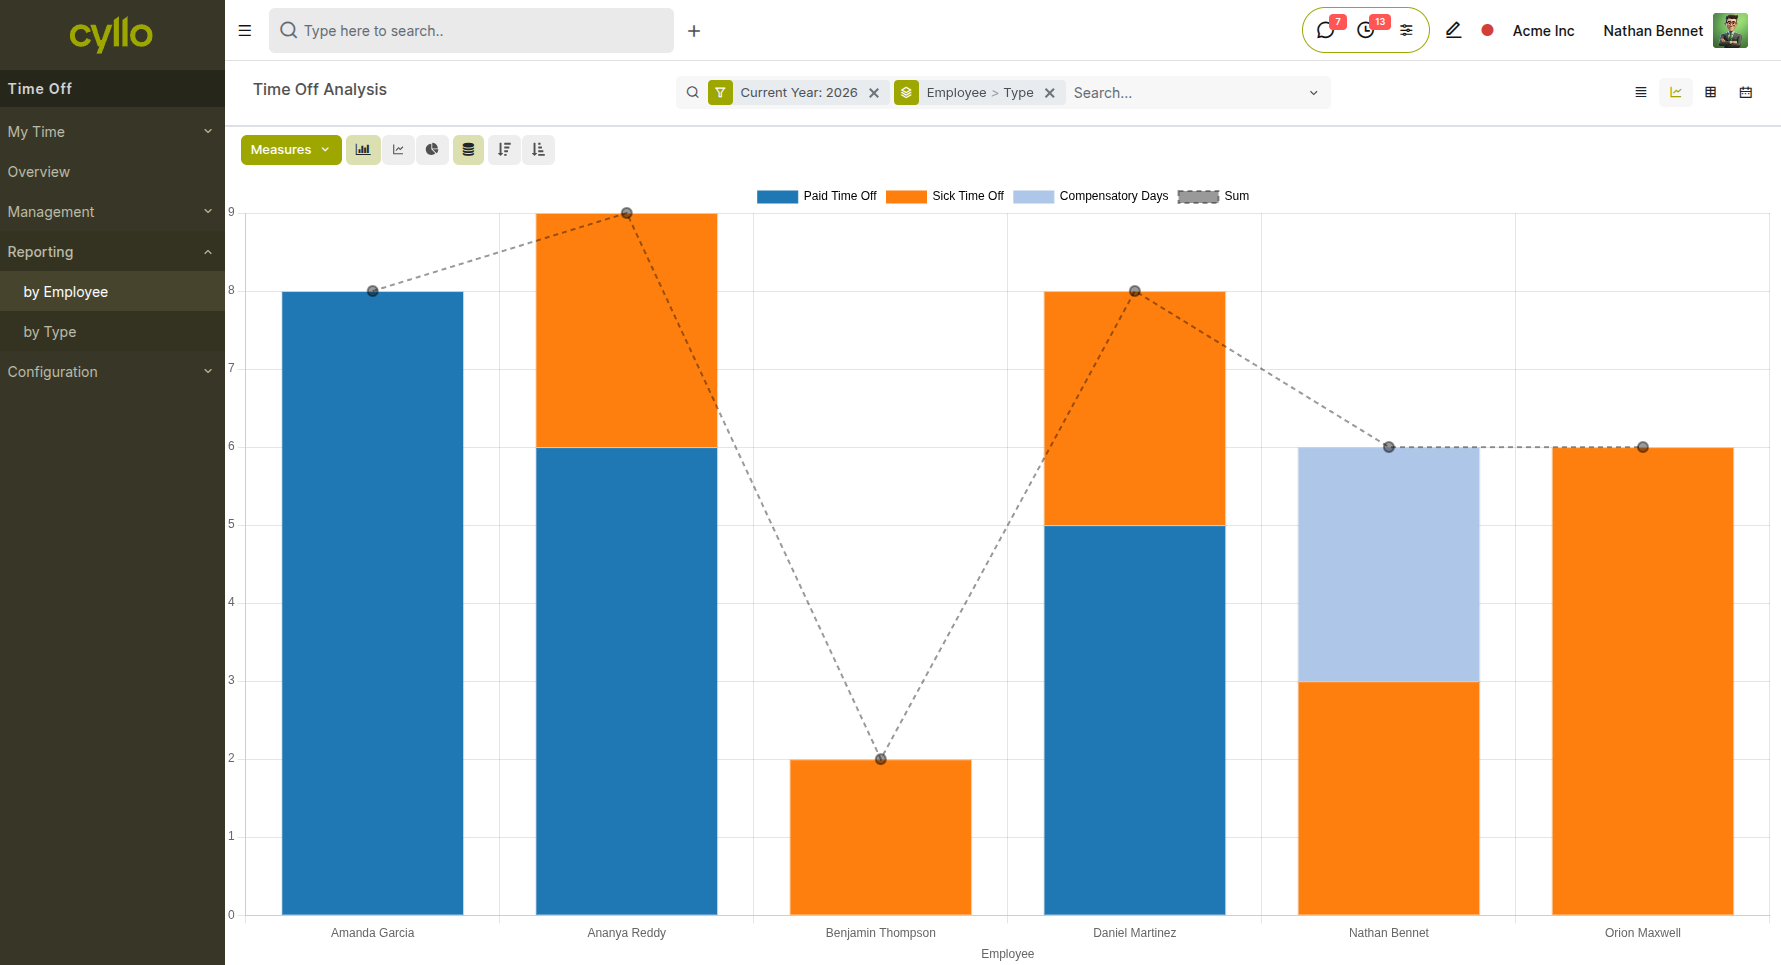
Fig 7.3 — Leave Analysis report in graph view showing employee name, leave type, and number of days
How to access Leave Analysis:
- Go to Time Off → Reporting → Leave Analysis
- Group by Employee, Department, or Leave Type to compare usage patterns
- Filter by the leave period (start and end date) and leave state (Approved, Refused, Draft)
7.4 Timesheet Reports
Timesheet Reports show hours logged per employee, project, and task. They are used for project cost tracking, billing validation, and productivity monitoring.
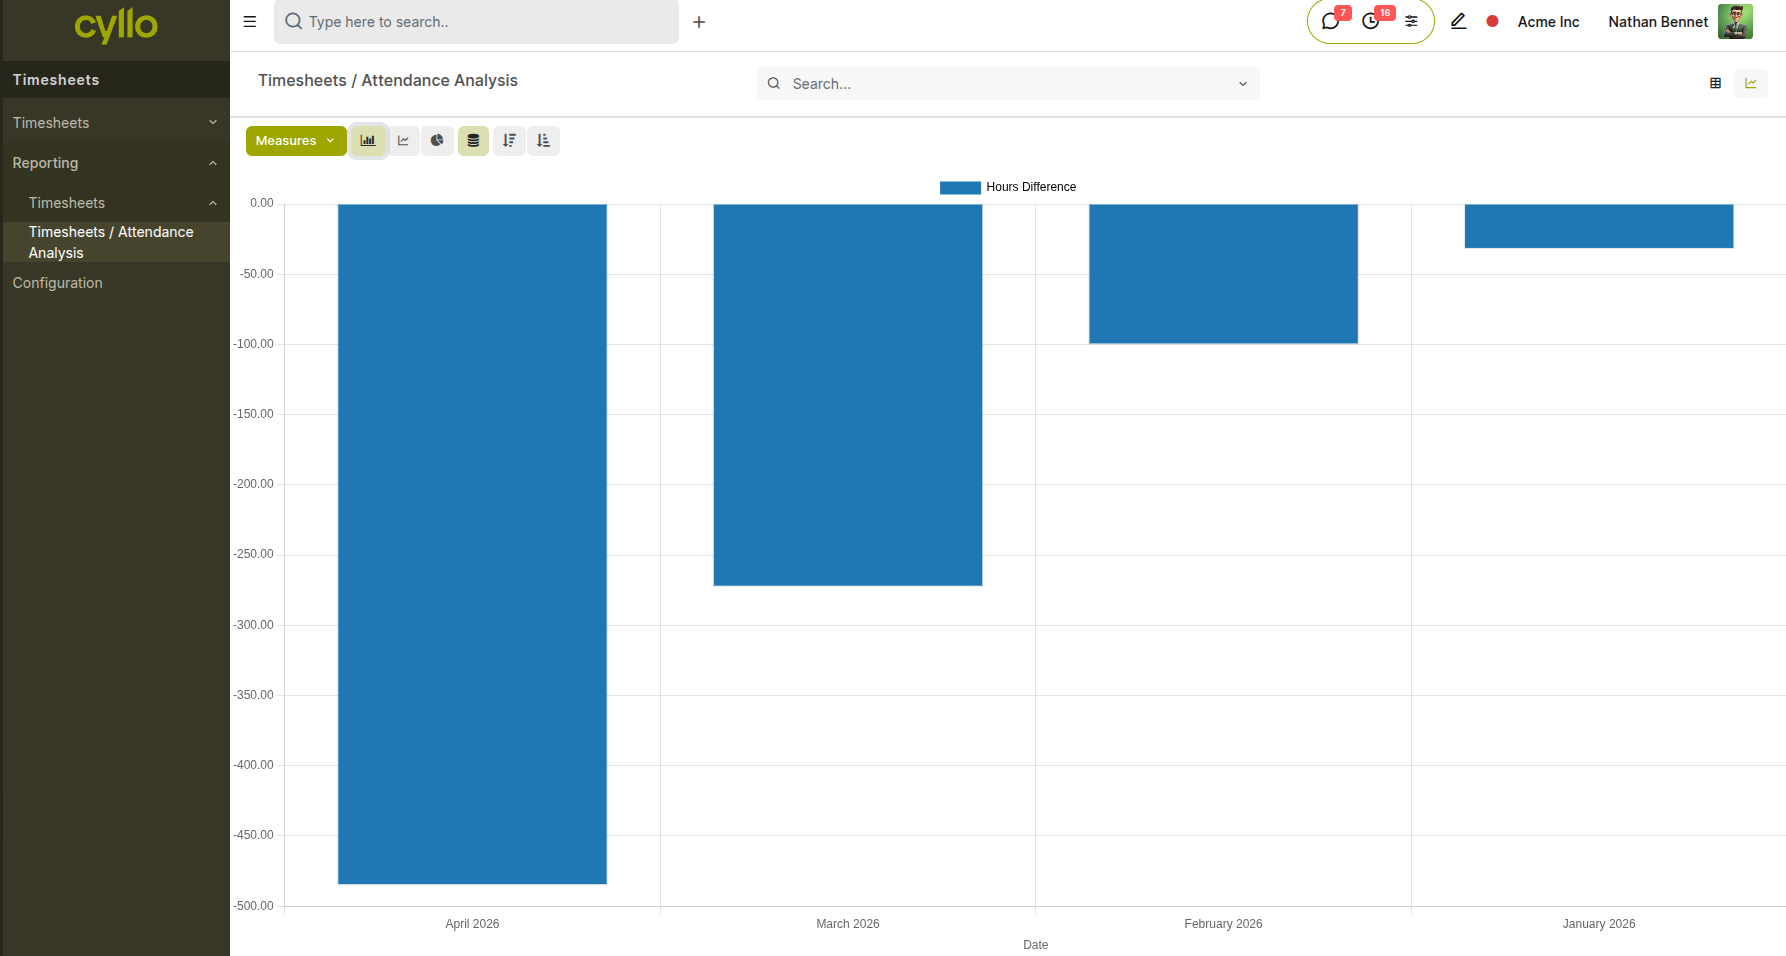
Fig 7.4 — Timesheet Analysis report in graph view showing attendance difference between timesheet and attendance
How to access Timesheet Reports:
- Go to Timesheets → Reporting → Timesheet Analysis
- Group by Employee, Project, or Task to analyze where time is being spent
- Filter by date range to focus on a specific billing period or sprint
- Switch to Graph view for a visual breakdown of effort distribution by project
8. Point of Sale Reports
The POS module provides reports for session-level sales reconciliation and long-term sales trend analysis.
8.1 Session Reports
Session Reports provide a detailed summary of each POS session — total sales, payment method breakdown (cash, card, wallet), cash-in/cash-out movements, and the opening and closing balance. They are the primary tool for daily reconciliation at the end of each shift.
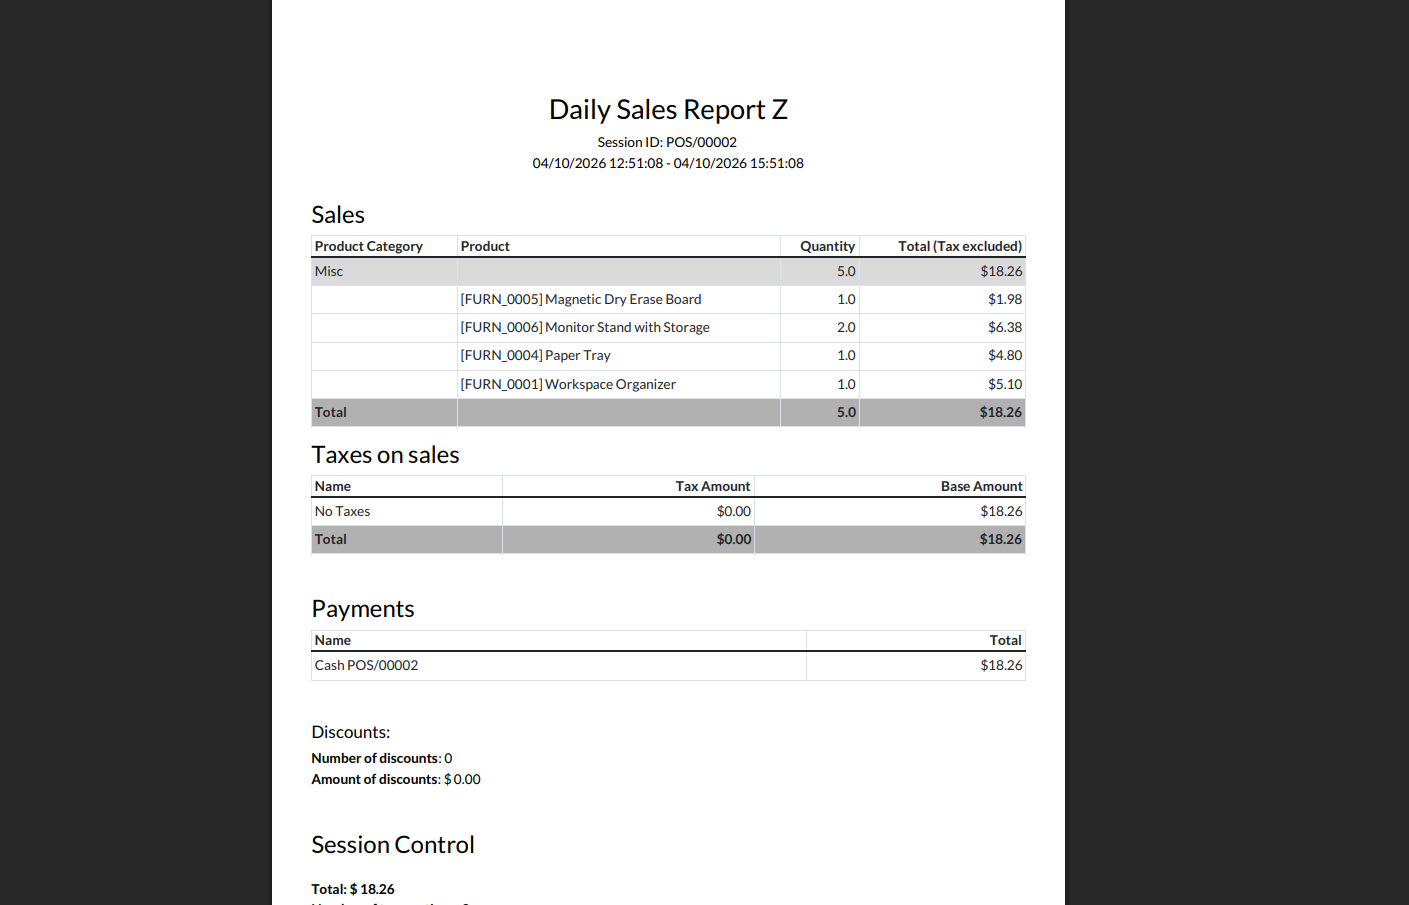
Fig 8.1 — POS Session Report showing total sales, payment breakdown by method, cash movements, and closing balance summary for a single session
How to access Session Reports:
- Go to Point of Sale → Sessions → All Sessions
- Open a closed session and click the Session Report button
- The report shows a full breakdown of every transaction in that session
9. Field Service Reports
9.1 Service Request Summary
The Field Service module allows service requests to be filtered and grouped to produce operational summaries — showing request volume by status, worker, skill category, priority, and time period. These views serve as the primary operational report for field service managers.
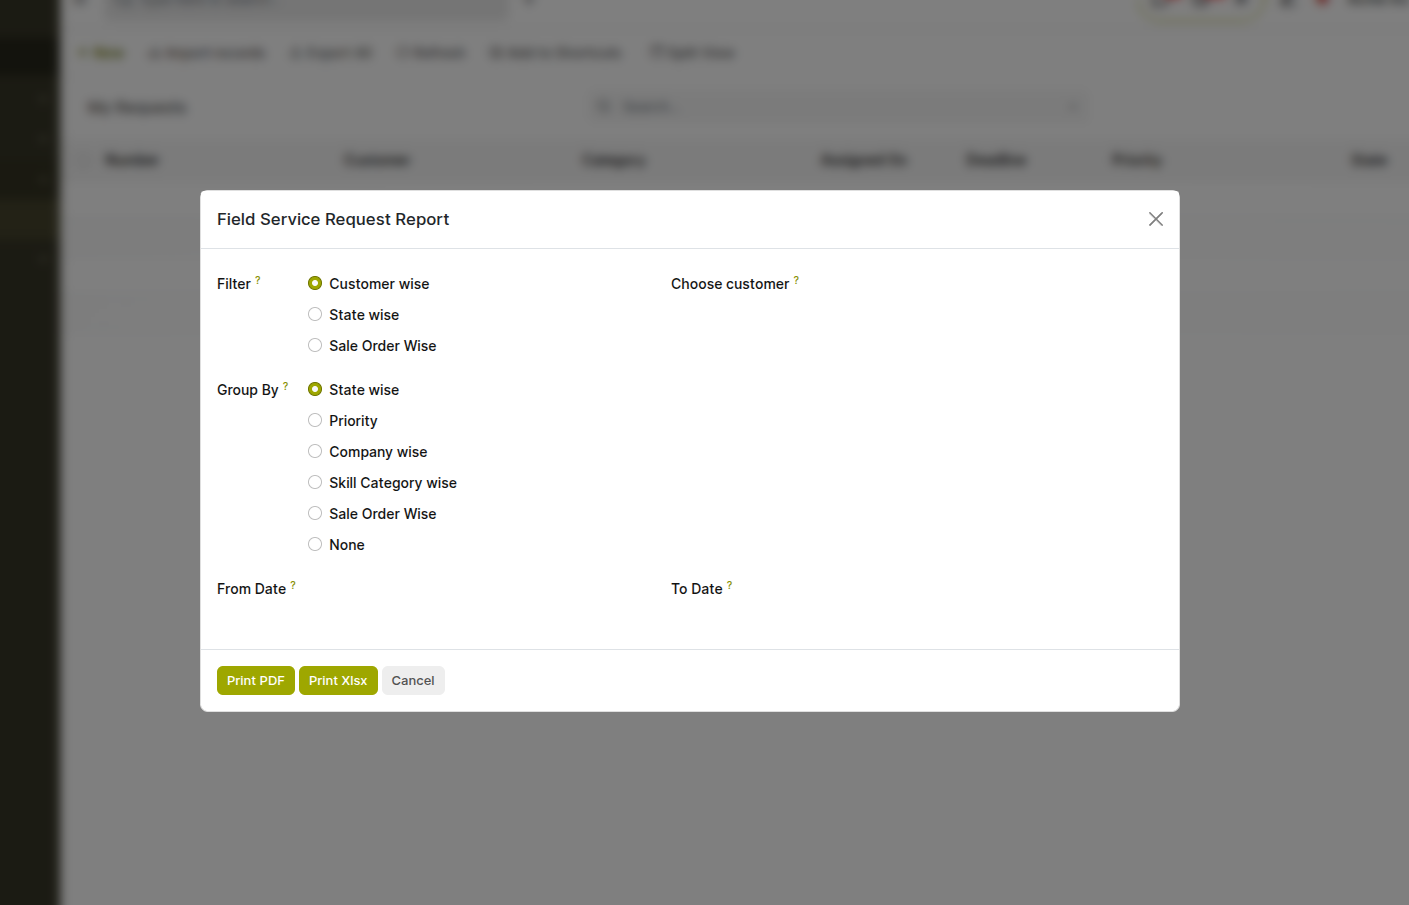
Fig 9.1 — Field Service request report dialog showing filter and group-by options for generating reports based on customer, status, priority, and date range.
How to access service request reports:
- Go to Field Service → Service Requests → All Requests
- Group by Status, Assigned Worker, or Skill Category
- Filter by date range, priority, or customer to narrow the scope
- Switch to Graph view for a visual breakdown of request volume and status distribution
10. Project Reports
10.1 Task Analysis
Task Analysis provides a breakdown of project tasks by stage, assignee, project, deadline, and completion status. It is the primary report for project managers to track workload distribution and deadline adherence across the team.
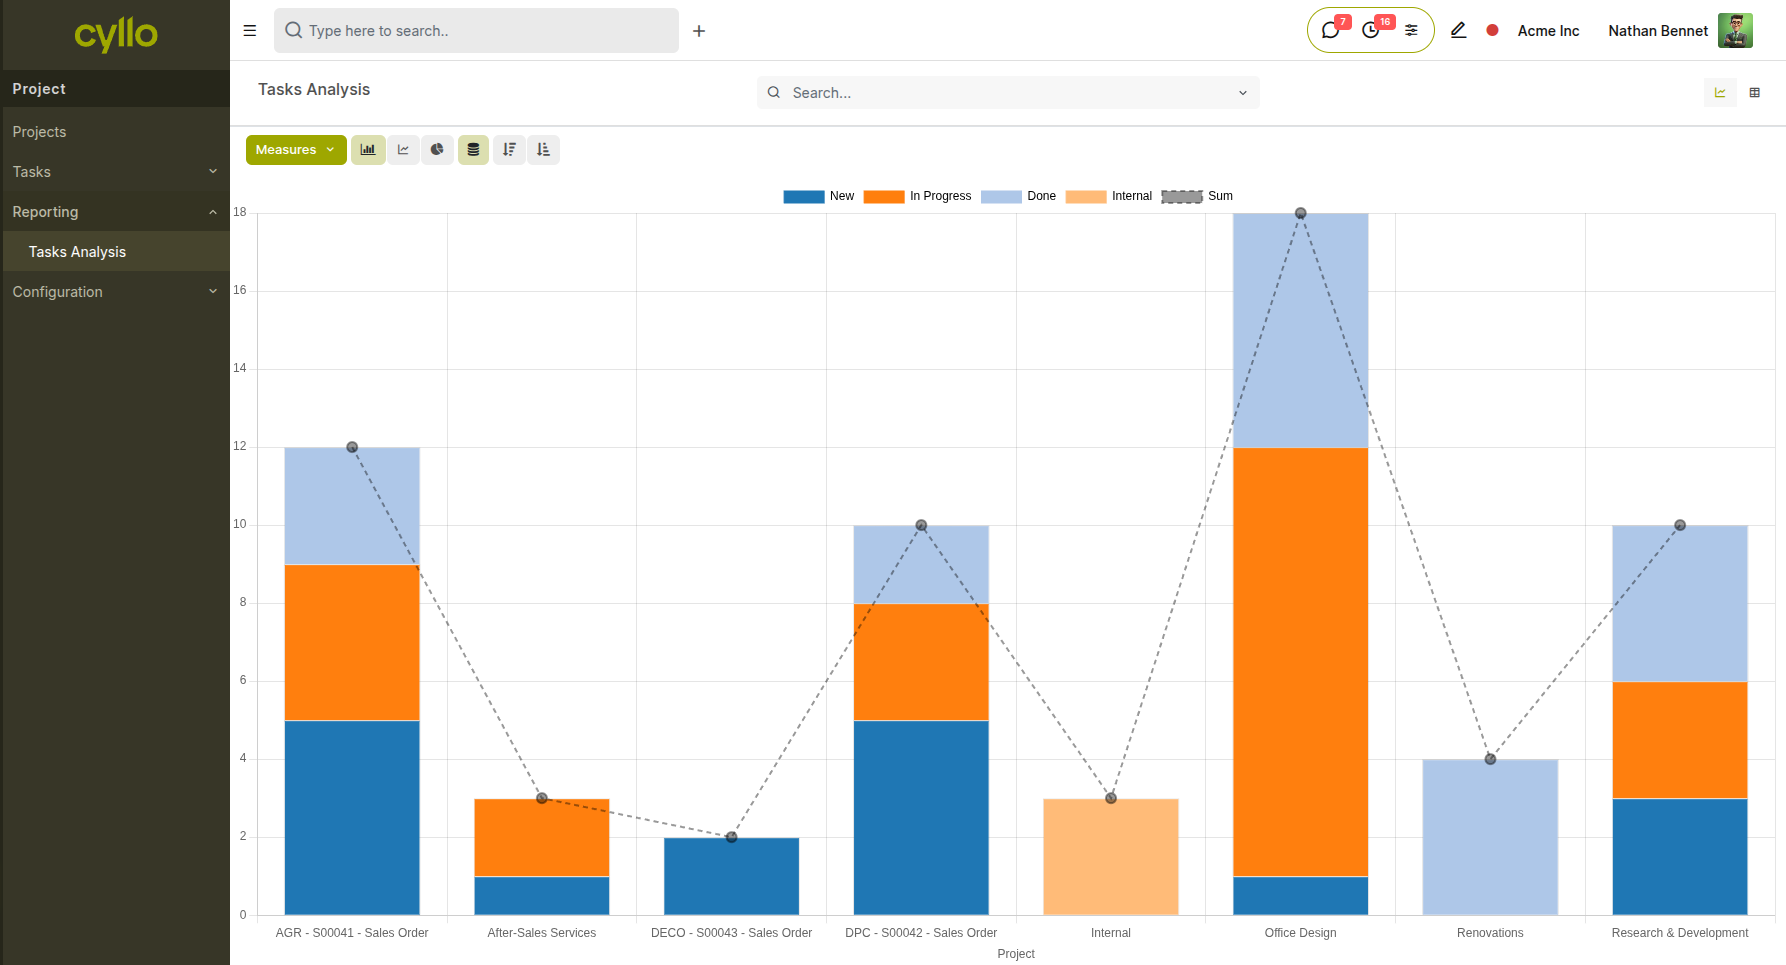
Fig 10.1 — Task Analysis report in graph view showing task counts by stage
How to access Task Analysis:
- Go to Project → Reporting → Task Analysis
- Group by Assignee, Project, or Stage to view workload distribution
- Filter by deadline or milestone to focus on at-risk tasks
11. Subscription Reports
11.1 Subscription Analysis
The Subscription Analysis report provides insights into subscription performance, including the number of active subscriptions and overall subscription trends. It allows users to analyze subscription data using different measures and grouping options for better visibility into recurring business performance.
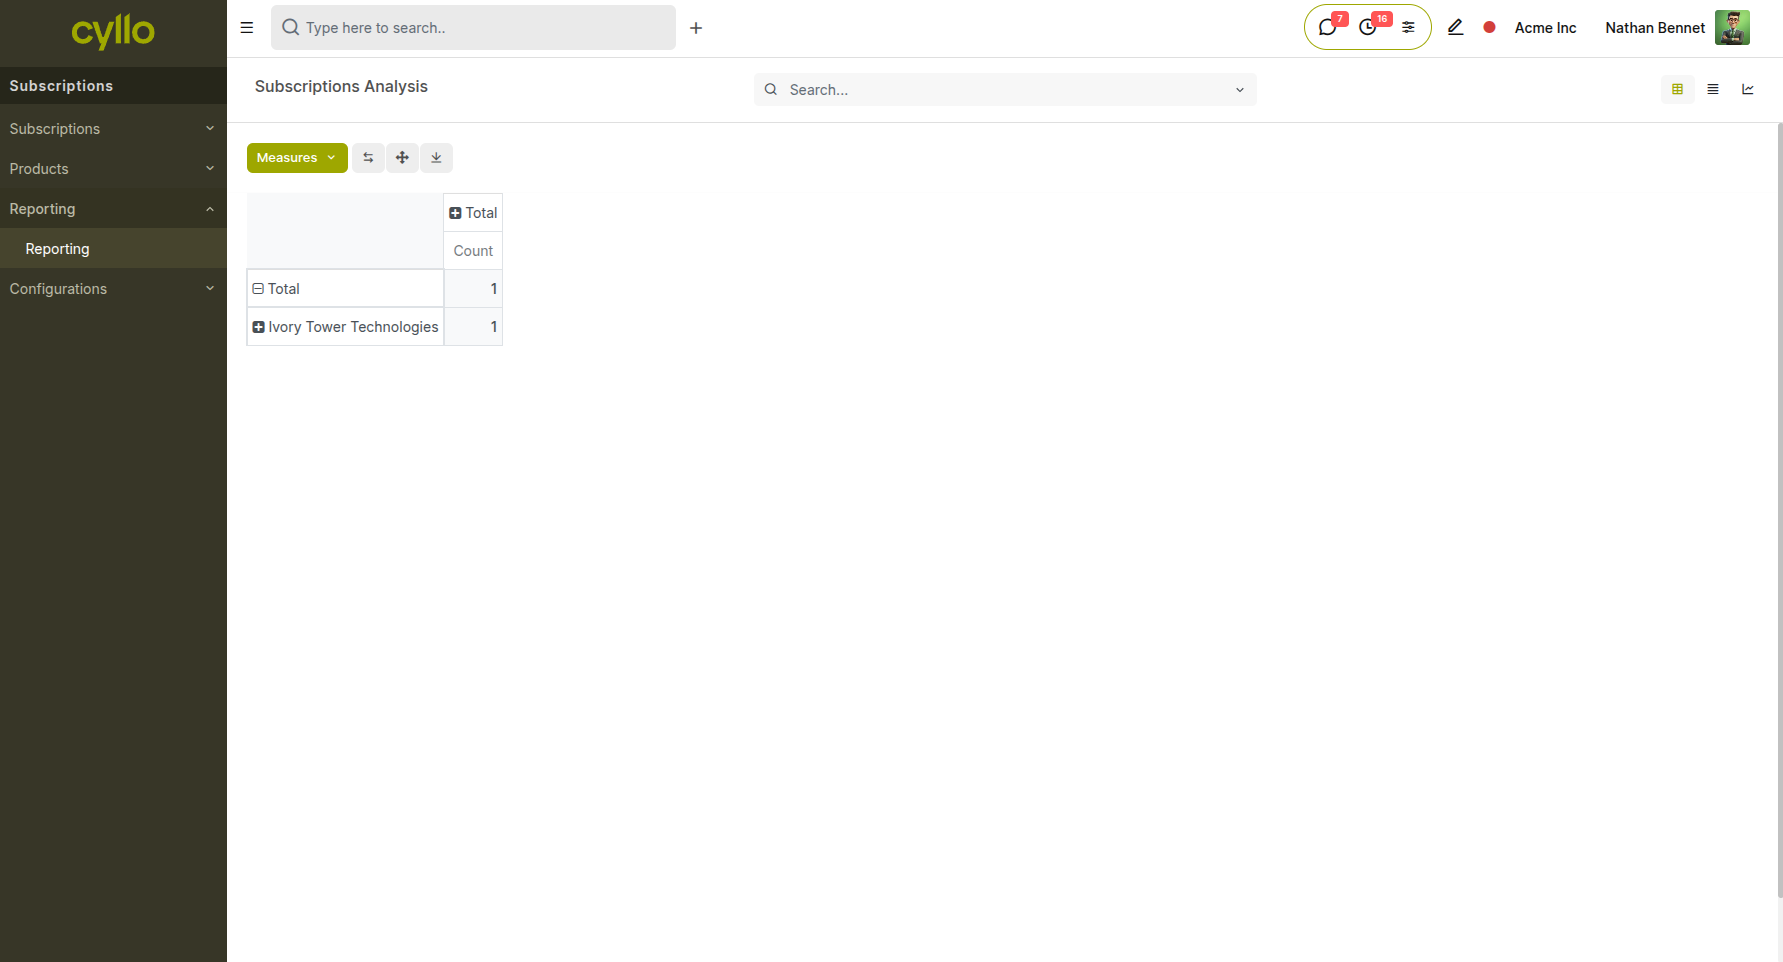
Fig 11.1 — Subscription Analysis report showing subscription count grouped by customer with selectable measures
How to access Subscription Analysis:
- Go to Subscriptions → Reporting → Subscriptions Analysis
- Apply filters such as Customer, Subscription Plan, or Date Range
- Use Group By (e.g., Customer, Plan, or Stage) to analyze distribution
- Select different Measures to evaluate subscription metrics
- Switch to Pivot or Graph view for visual analysis
Note
The Subscription Analysis report is available only when the Subscription module is installed and active subscriptions exist.