

Cyllo Analytics Documentation
Introduction
Cyllo Analytics is the built-in Business Intelligence module that eliminates the need for external BI tools. It connects directly to all your Cyllo data — Sales, Inventory, HR, Accounting, Manufacturing, and more — and lets any user build live interactive dashboards using a simple drag-and-drop interface, with no SQL knowledge or developer involvement required. Whether you need a quick KPI tile showing today's revenue, a multi-chart dashboard for weekly management review, or an AI-powered churn prediction report for your sales team, Cyllo Analytics delivers it all from within the same platform your team already uses every day.
1. Chart Builder
1.1 Creating a Chart
The Chart Builder is the core of Cyllo Analytics. It allows any user to create a live interactive chart by selecting a data model and choosing which fields to display — Cyllo auto-generates the underlying SQL query and renders the result instantly.
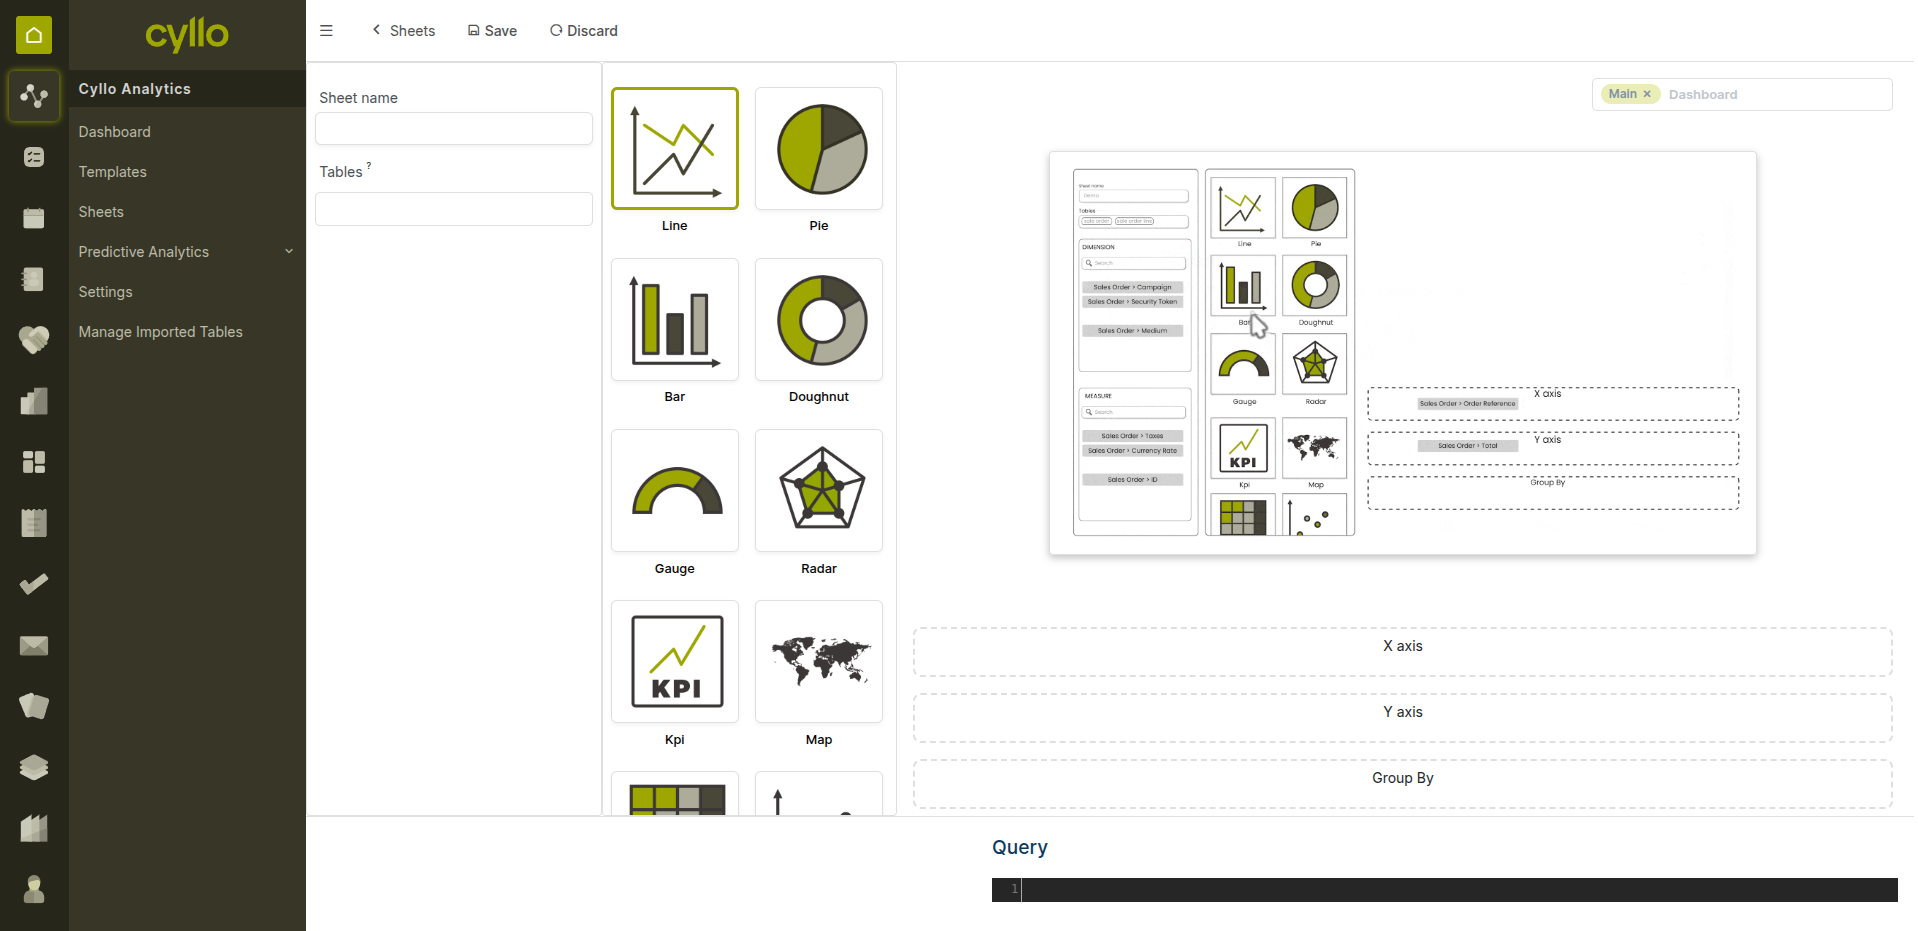
Fig 1.1 — Cyllo Analytics chart builder with model selector and field configuration
How to Create a Chart:
- Go to Analytics → New Chart (or open an existing dashboard and click Add Chart)
- Enter a Chart Name
- Select the Model — the data source for this chart (e.g., Sale Order, Invoice, Employee)
- Choose the Measure (Y-axis) — the value to calculate (e.g., Total Amount, Count, Quantity)
- Choose the Dimension (X-axis) — the grouping field (e.g., Salesperson, Month, Department)
- Select the Chart Type: Bar, Line, Pie, Stacked, or Tile
- Apply any Filters to scope the data (e.g., only confirmed orders, current year)
- Click Save — the chart renders instantly with live data.
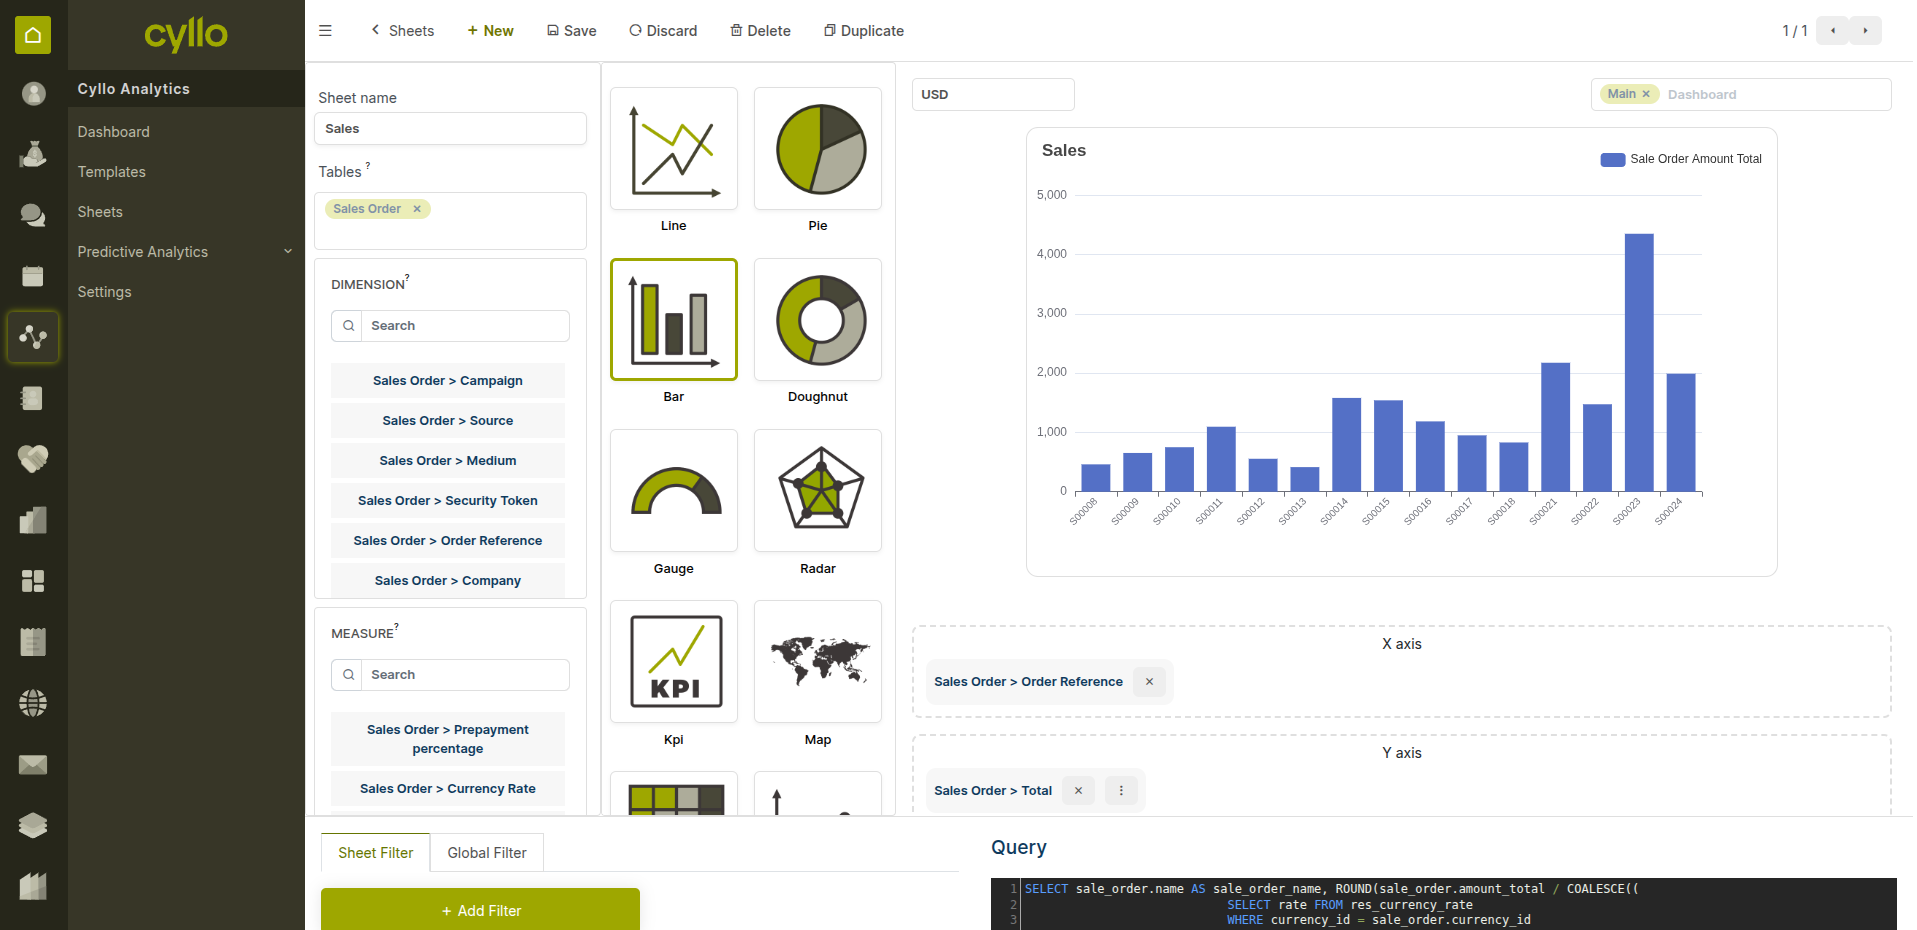
Fig 1.2 — Live bar chart generated from Sales Order model grouped by salesperson
Key Fields
- Model: The Cyllo data table the chart pulls from (e.g., sale.order, hr.payslip).
- Measure: The numeric value being calculated — Sum, Count, Average, Min, Max.
- Dimension: The field used to group or split the data on the X-axis.
- Filter: Domain conditions that restrict which records are included in the chart.
- Chart Type: The visual format — Bar, Line, Pie, Stacked Bar, or Tile (KPI card).
Note
You do not need to write any SQL. Cyllo Analytics auto-generates the query from your field selections — the result is always live and reflects current data in the system.
1.2 Selecting Models & Fields
Every Cyllo module exposes its data as a model that can be used as a chart source. You can build charts from any model across Sales, HR, Accounting, Inventory, Manufacturing, and more.
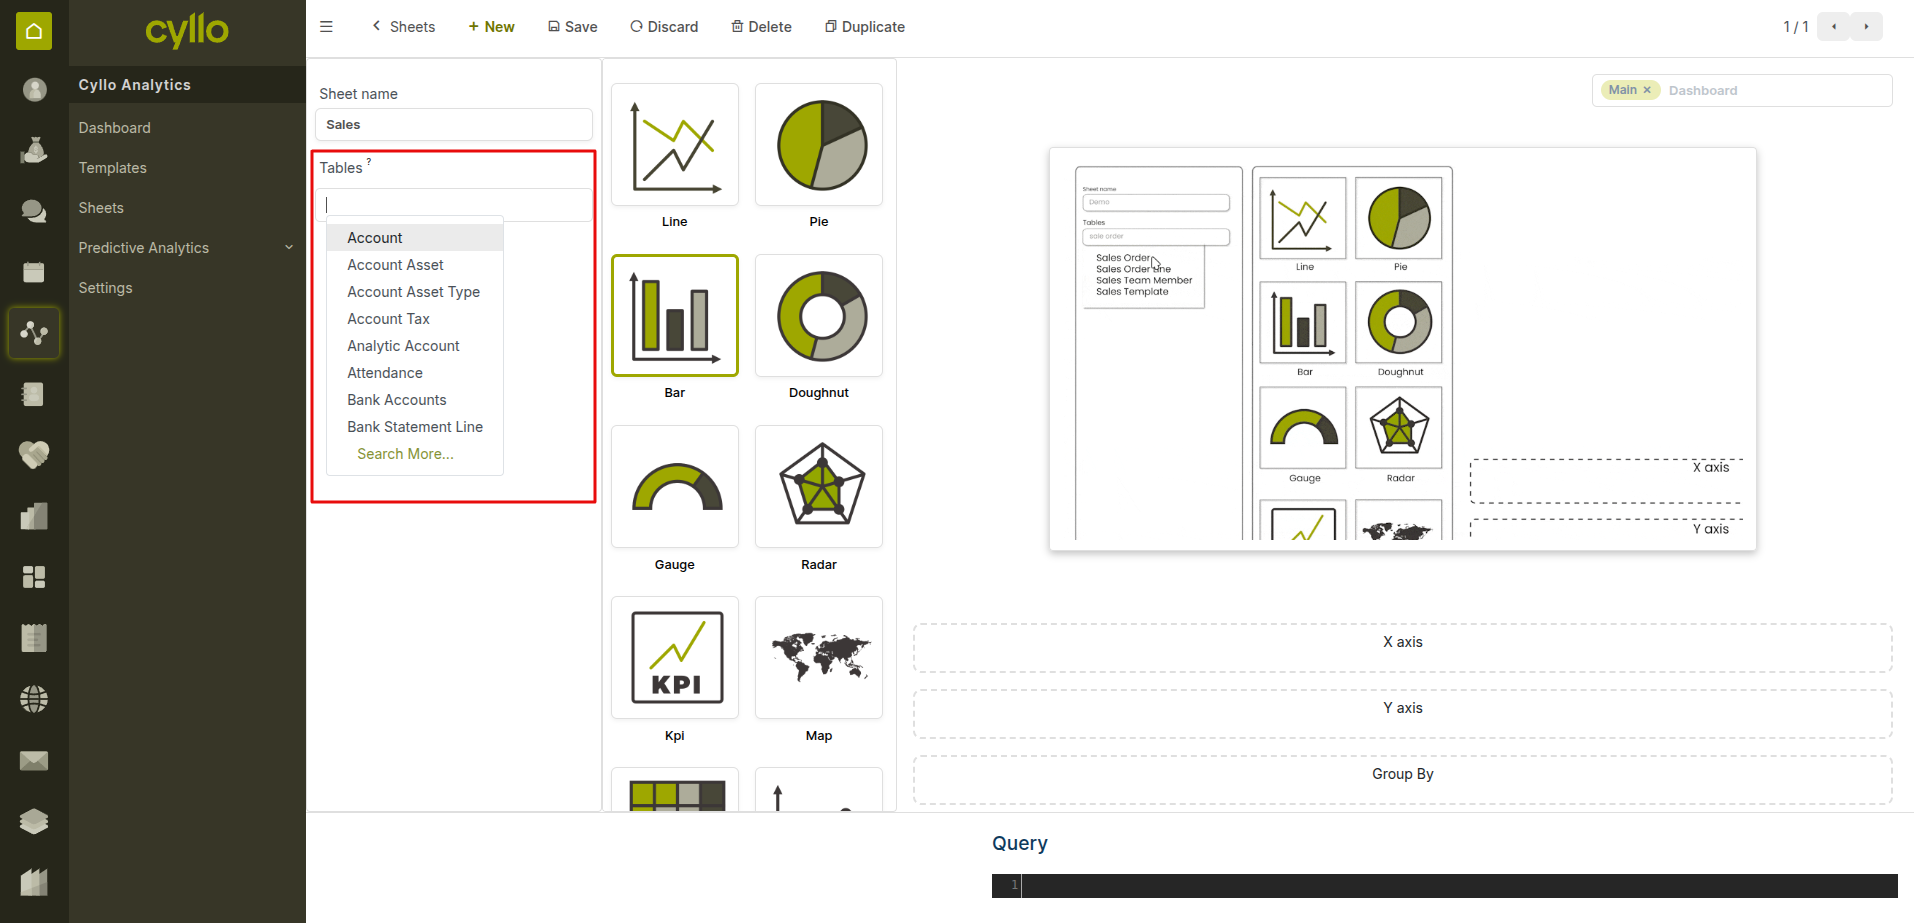
Fig 1.3 — Model selector showing available Cyllo data sources for chart building
Common Models & What They Power:
- Sale Order: Revenue by salesperson, monthly sales trends, order count by status.
- CRM Lead: Pipeline value by stage, lead conversion rates, team performance.
- Account Move: Invoice totals, overdue receivables, revenue by account.
- HR Payslip: Payroll cost by department, net salary trends, deduction breakdown.
- Stock Move: Inventory movements, product consumption, warehouse transfer analysis.
- Manufacturing Order: Production output by product, MO completion rates, scrap rates.
- Attendance: Worked hours by employee, overtime trends, absence patterns.
Note
If a model is not visible in the selector, it may require enabling the relevant module first. Contact your system administrator to confirm module access permissions
1.3 Chart Types
Cyllo Analytics supports many chart types — each suited to different analytical needs.
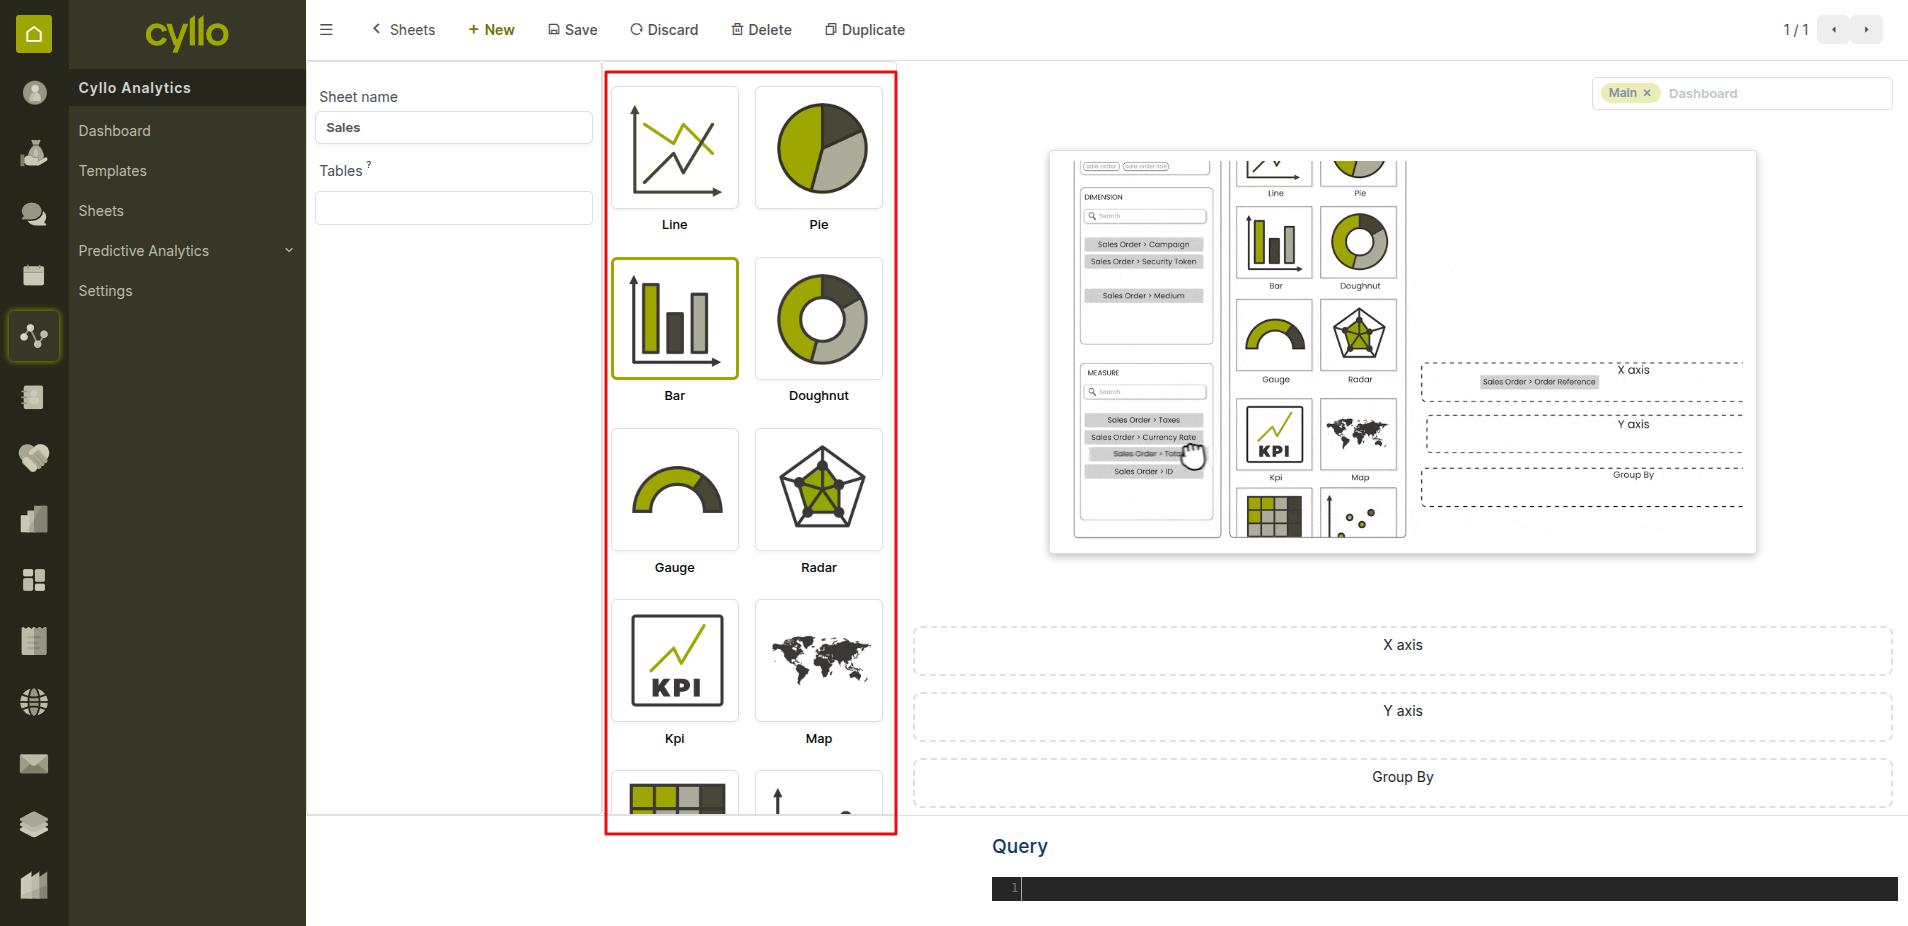
Fig 1.4 — Chart type tile options
Chart Types & When to Use Them:
- Bar Chart: Compare values across categories — ideal for sales by product, headcount by department.
- Line Chart: Show trends over time — ideal for monthly revenue, daily attendance, weekly production.
- Pie Chart: Show proportional distribution — ideal for market share, expense breakdown by category.
- Stacked Bar Chart: Compare totals and composition — ideal for team revenue with individual contributions.
- Tile (KPI Card): Display a single key metric prominently — ideal for today's revenue, open invoices count, active employees.
Note
Use Tile charts for executive dashboards where a quick at-a-glance number is more valuable than a detailed breakdown. Combine tiles with bar and line charts on the same dashboard for a complete view.
1.4 Filters & Grouping
Filters restrict the data included in a chart. Grouping adds a secondary dimension to break data down further — for example, sales by product grouped by month.
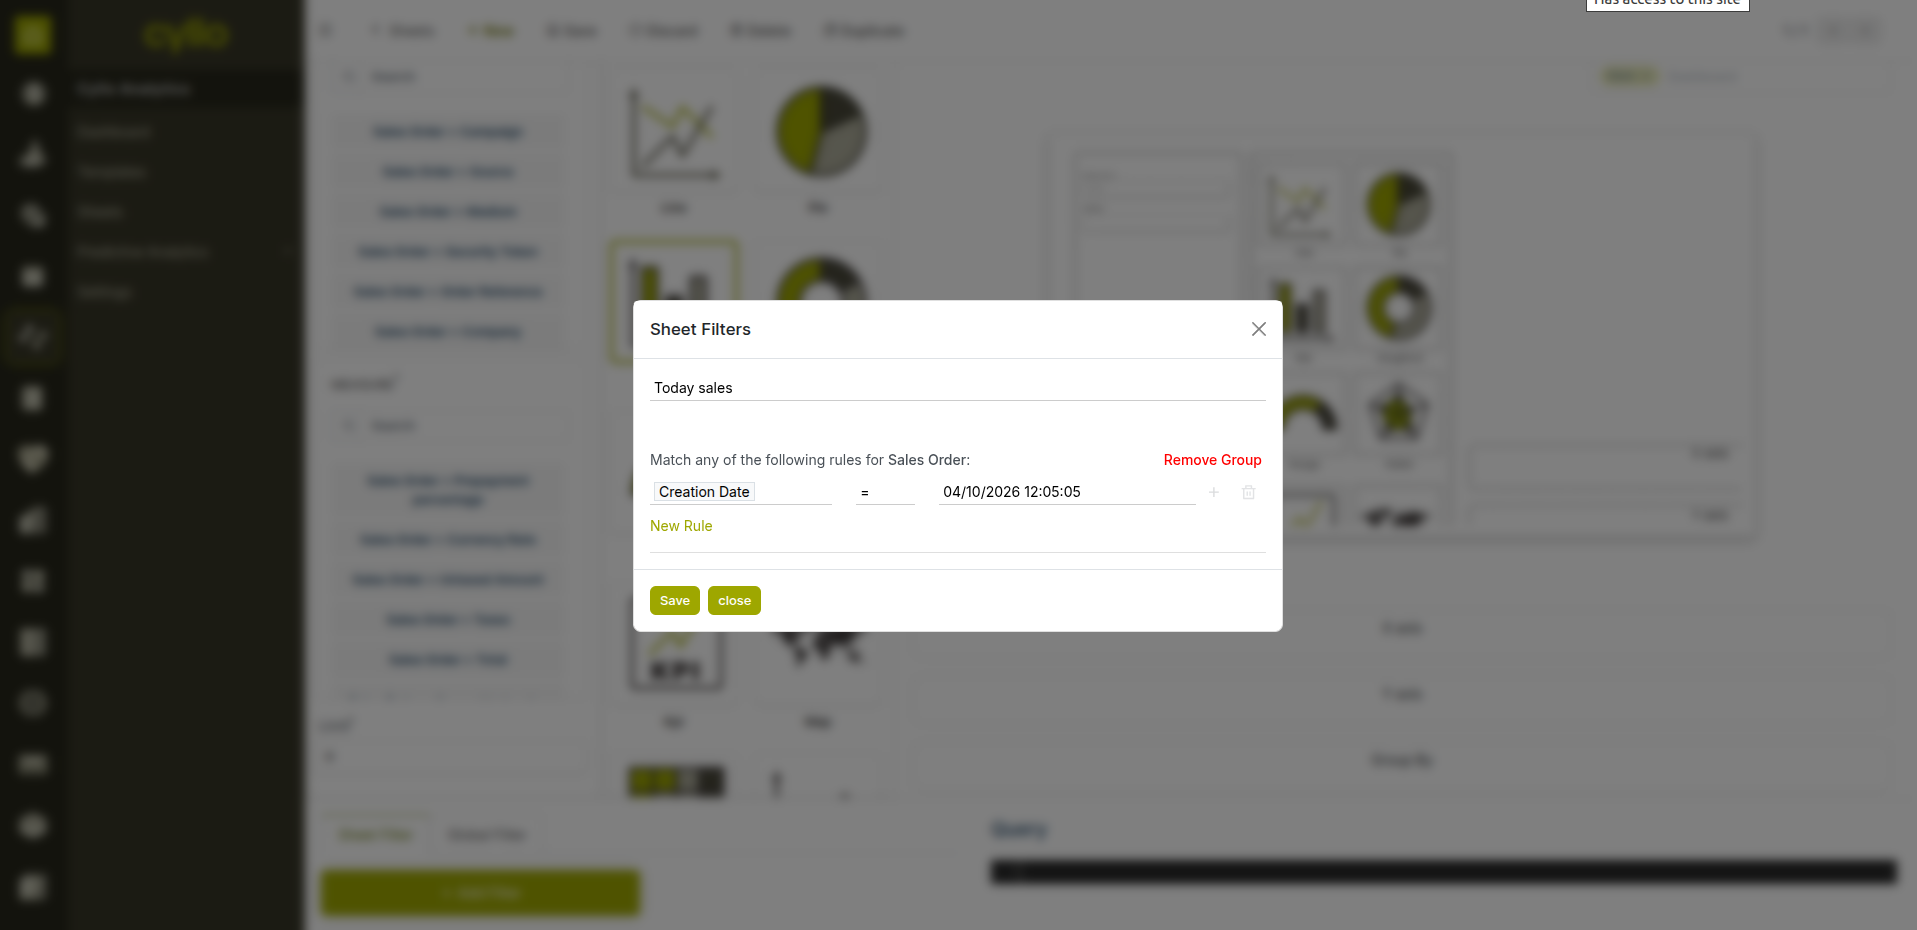
Fig 1.5 — Filter and grouping configuration on a chart
How to Apply Filters & Grouping:
- In the Chart Builder, click the Filters section
- Add a filter condition: select Field → Operator → Value (e.g., Status = Confirmed)
- Combine multiple filters using AND / OR logic
- To add a secondary grouping, select a second Dimension field
- Cyllo applies the filter and re-renders the chart instantly
- Save the chart to preserve the filter configuration
Note
Date filters support dynamic ranges — use "Current Month", "Last Quarter", or "This Year" so the chart always shows the relevant period without manual updates.
2. Dashboard Management
2.1 Creating a Dashboard
A Dashboard combines multiple charts into a single organised view — giving teams a one-screen overview of all their key metrics without switching between reports.
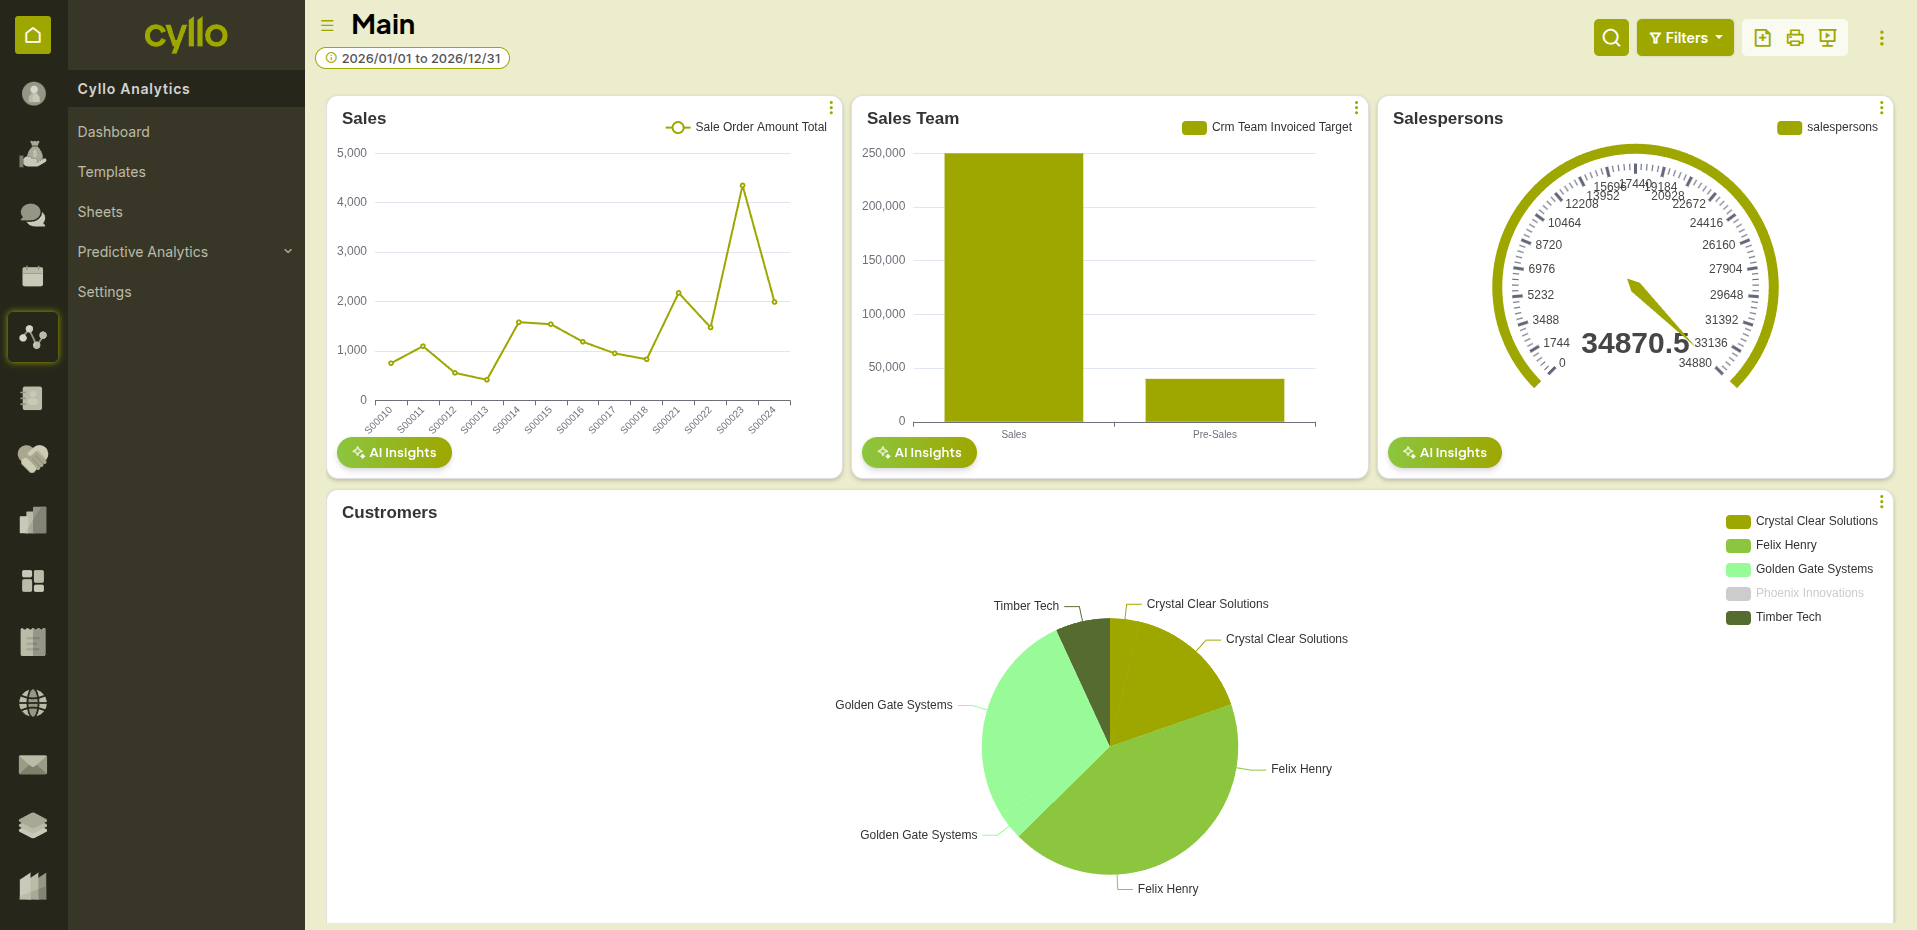
Fig 2.1 — Analytics dashboard with multiple charts arranged in a grid layout
How to Create a Dashboard:
- Go to Analytics → Dashboards → New
- Enter a Dashboard Name (e.g., Sales Performance, HR Overview, Finance Monthly)
- Click Add Chart to add your first chart
- Select an existing chart or create a new one
- Repeat to add more charts
- Arrange charts by dragging them into position
- Save the dashboard
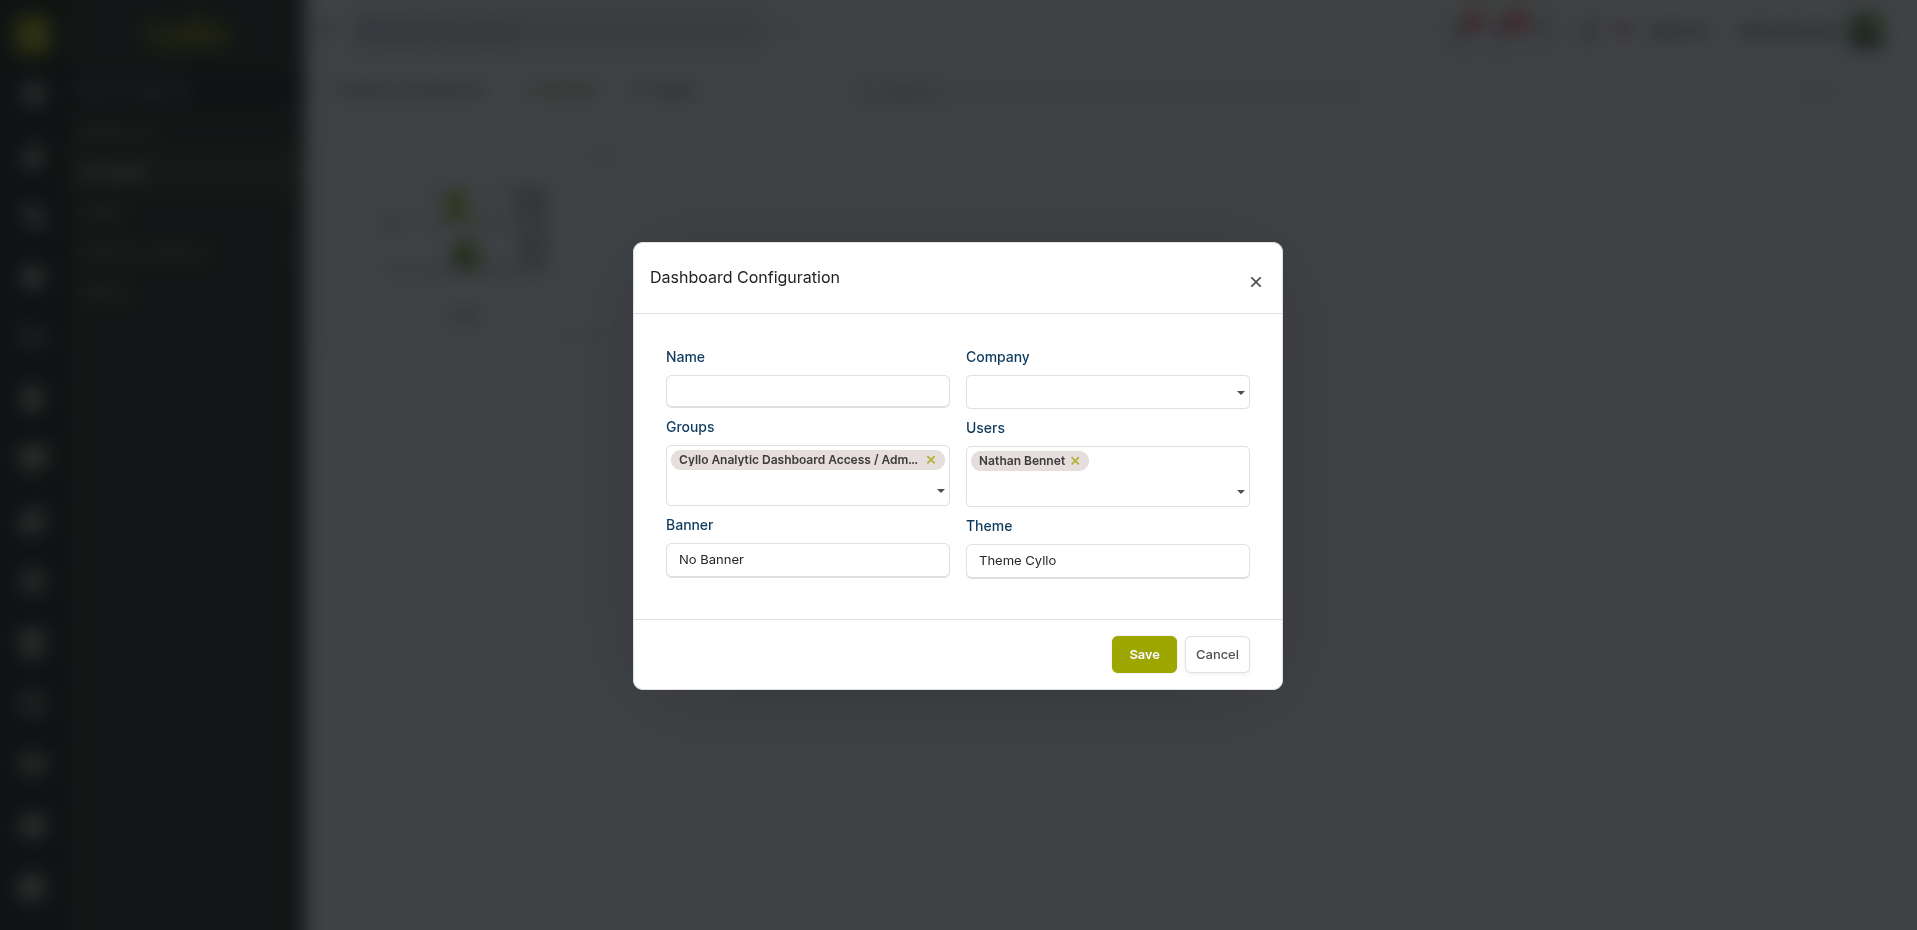
Fig 2.2 — Dashboard creation form with name and initial chart configuration
Key Fields Dashboard Name: The title shown in the menu and dashboard list. Charts (Sheets): The individual chart panels that make up the dashboard. Layout: Drag-and-drop grid — resize and reorder charts freely. Access: Dashboards can be shared with specific users or teams.
2.2 Adding & Arranging Charts
Charts on a dashboard can be freely rearranged and resized to create the most useful layout for your team.
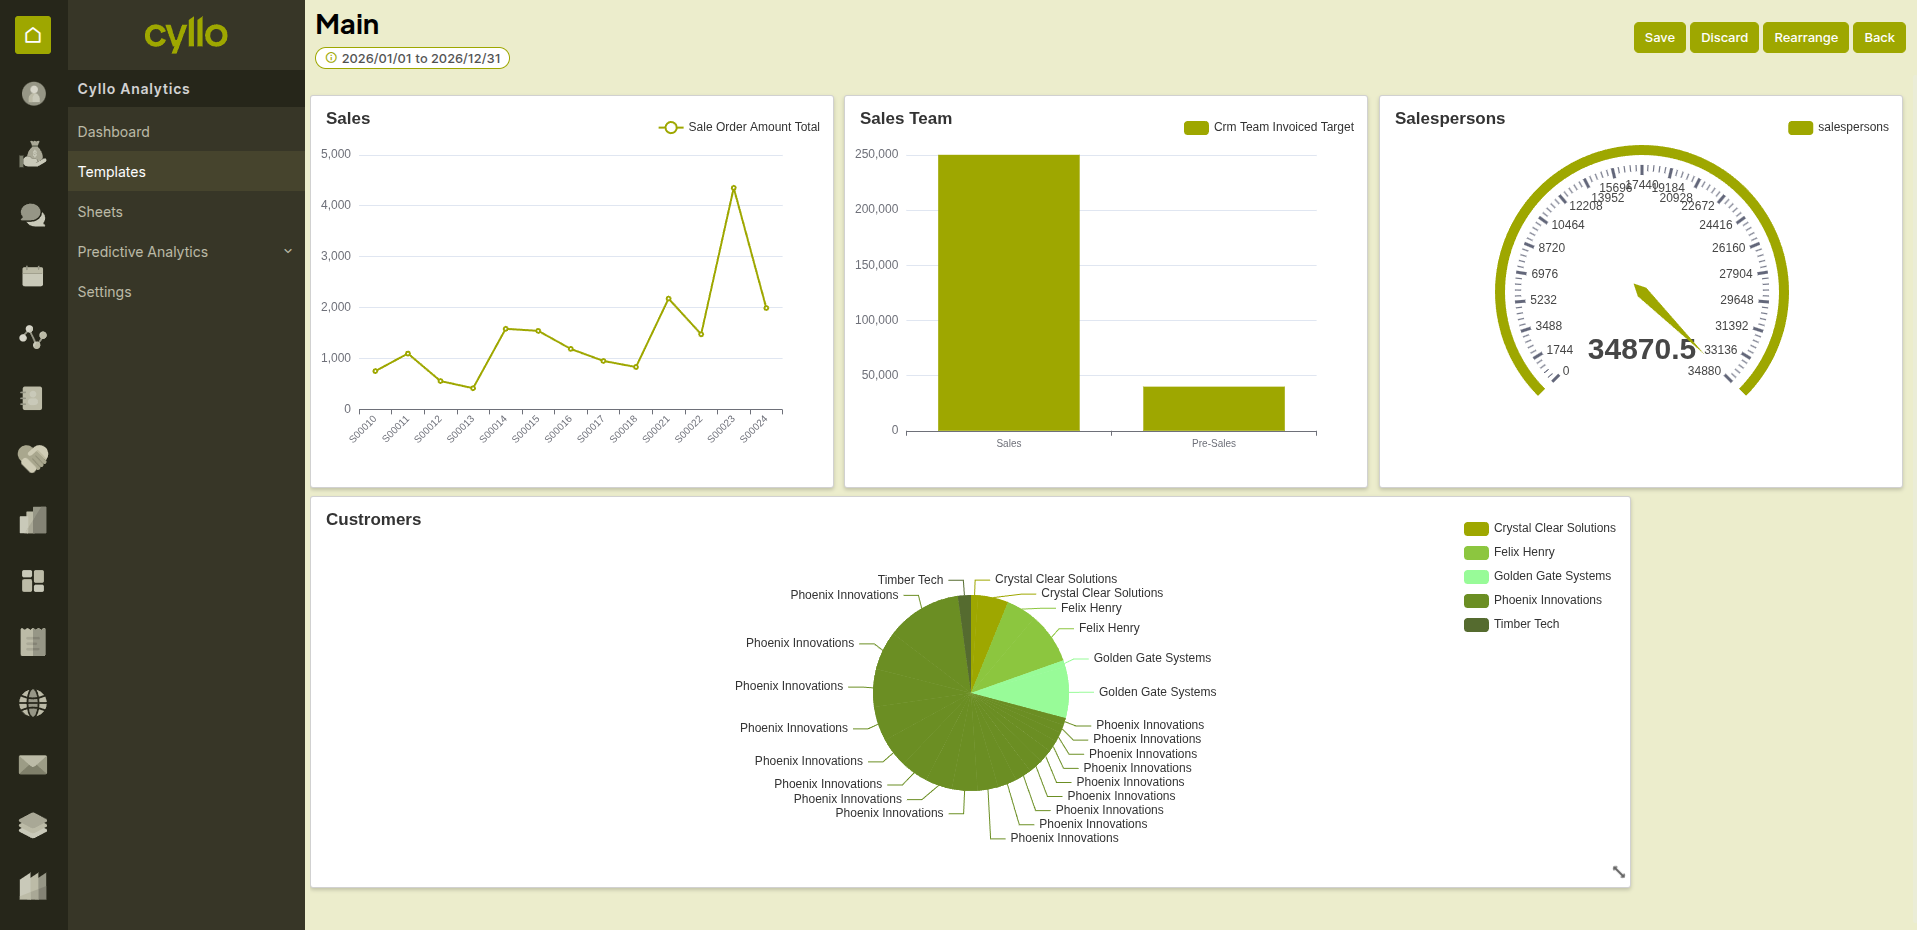
Fig 2.3 — Dashboard in edit mode showing drag handles and resize controls
How to Arrange Charts on a Dashboard:
- Open the dashboard and click Edit layout
- Drag any chart by its header to move it to a new position
- Drag the bottom-right corner of a chart to resize it
- Click the X on a chart to remove it from the dashboard (the chart itself is not deleted)
- Click Add Chart to insert additional charts
- Click Save when the layout is complete
Note
Larger charts are better for detailed breakdowns (bar, line, stacked). Smaller tiles are best for KPI numbers. A good dashboard mixes both — KPI tiles at the top, detailed charts below.
2.3 KPI Tile View
Tile charts display a single bold number — the most important metric for a given area. They are designed for executive dashboards and daily operations screens where speed of reading matters.
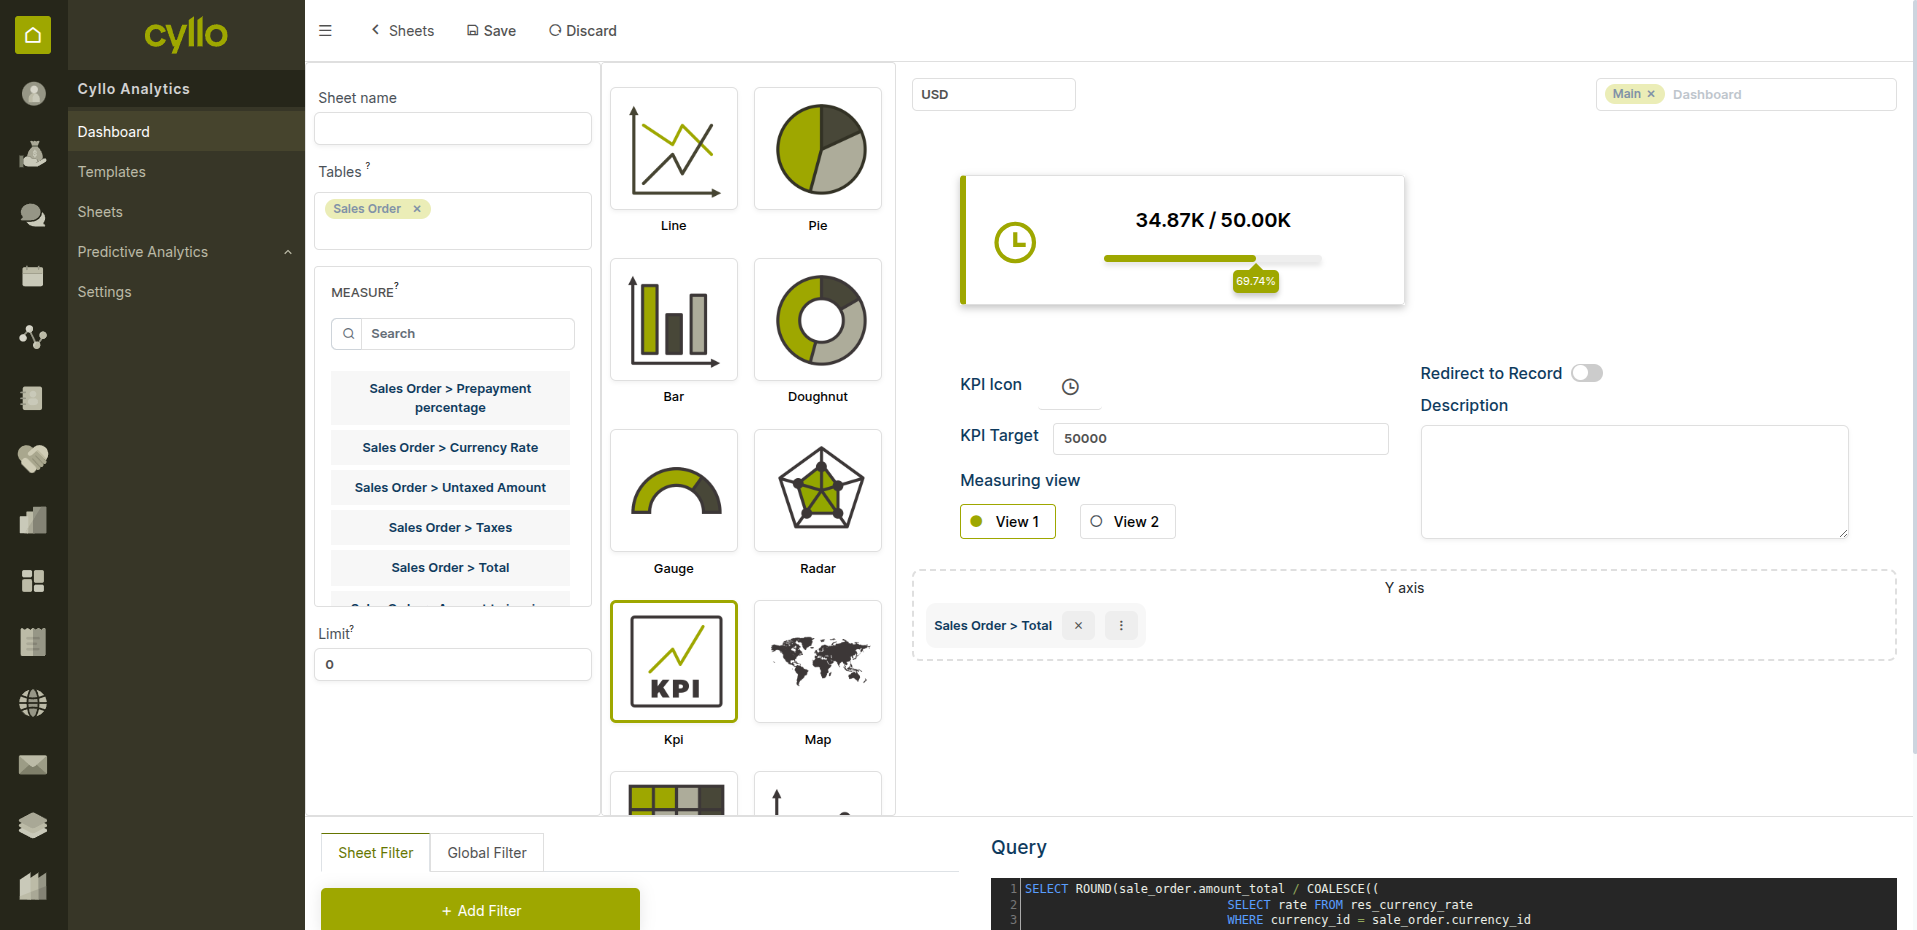
Fig 2.4 — KPI tile cards
- Set the Chart Type to Tile
- Apply a filter to scope the metric (e.g., Order Date = Today, Status = Confirmed)
- Enter a descriptive Chart Name that labels the metric clearly
- Save and add to your dashboard
Note
KPI tiles update in real time — every time the dashboard is opened or refreshed, the number reflects the current state of data in Cyllo.
2.4 Pinning to Module Menu
Dashboards can be pinned as a quick-access menu item inside any Cyllo module — so your team lands on their analytics view the moment they open the module.
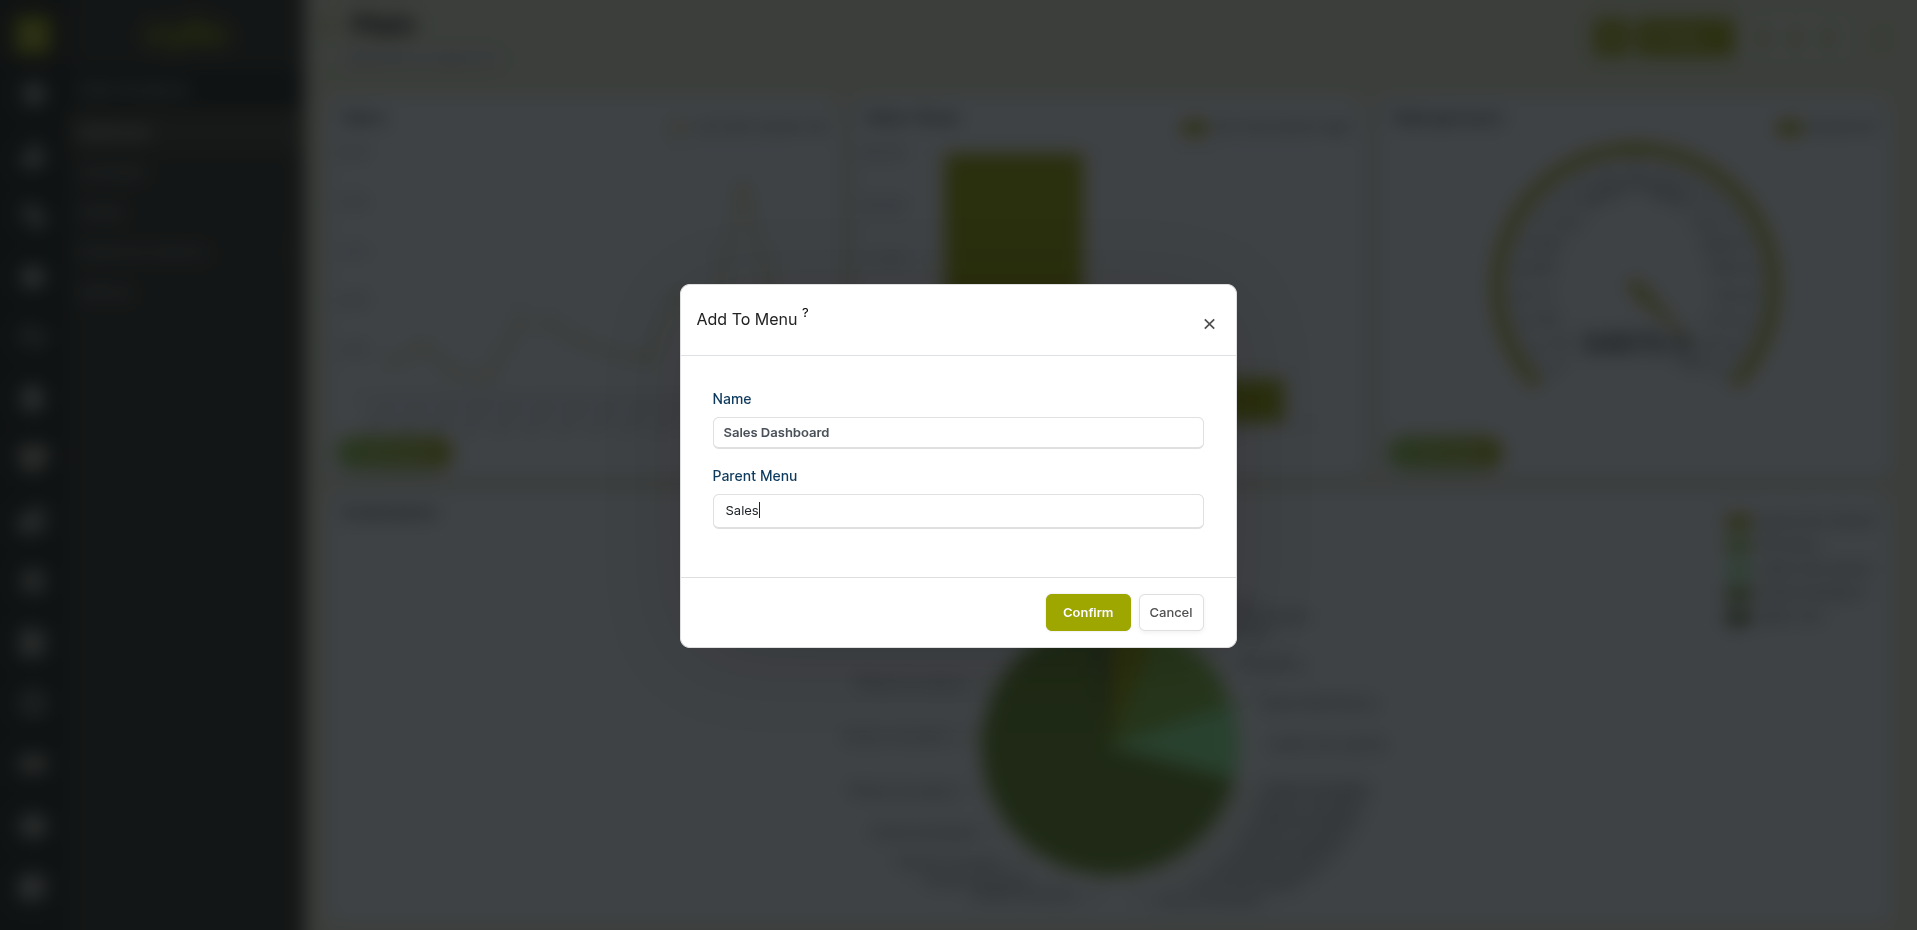
Fig 2.5 — Quick access menu showing pinned Analytics dashboard inside the Sales module
How to Pin a Dashboard to a Module:
- Open the dashboard you want to pin
- Click the Quick Access Menu option (pin icon or settings)
- Select the Module where the dashboard should appear (e.g., Sales, HR, Accounting)
- Save — the dashboard now appears as a menu item inside the selected module
- Team members see the dashboard immediately when they navigate to that module
Note
Pin role-specific dashboards to the relevant module — pin the HR Overview dashboard to the Employees module, the Sales Performance dashboard to Sales, and so on.
3. AI-Powered Insights
3.1 Asking Questions on a Chart
Every chart on a Cyllo Analytics dashboard has an AI assistant built in. You can type a plain-language question about the data shown and receive an instant AI-generated explanation.
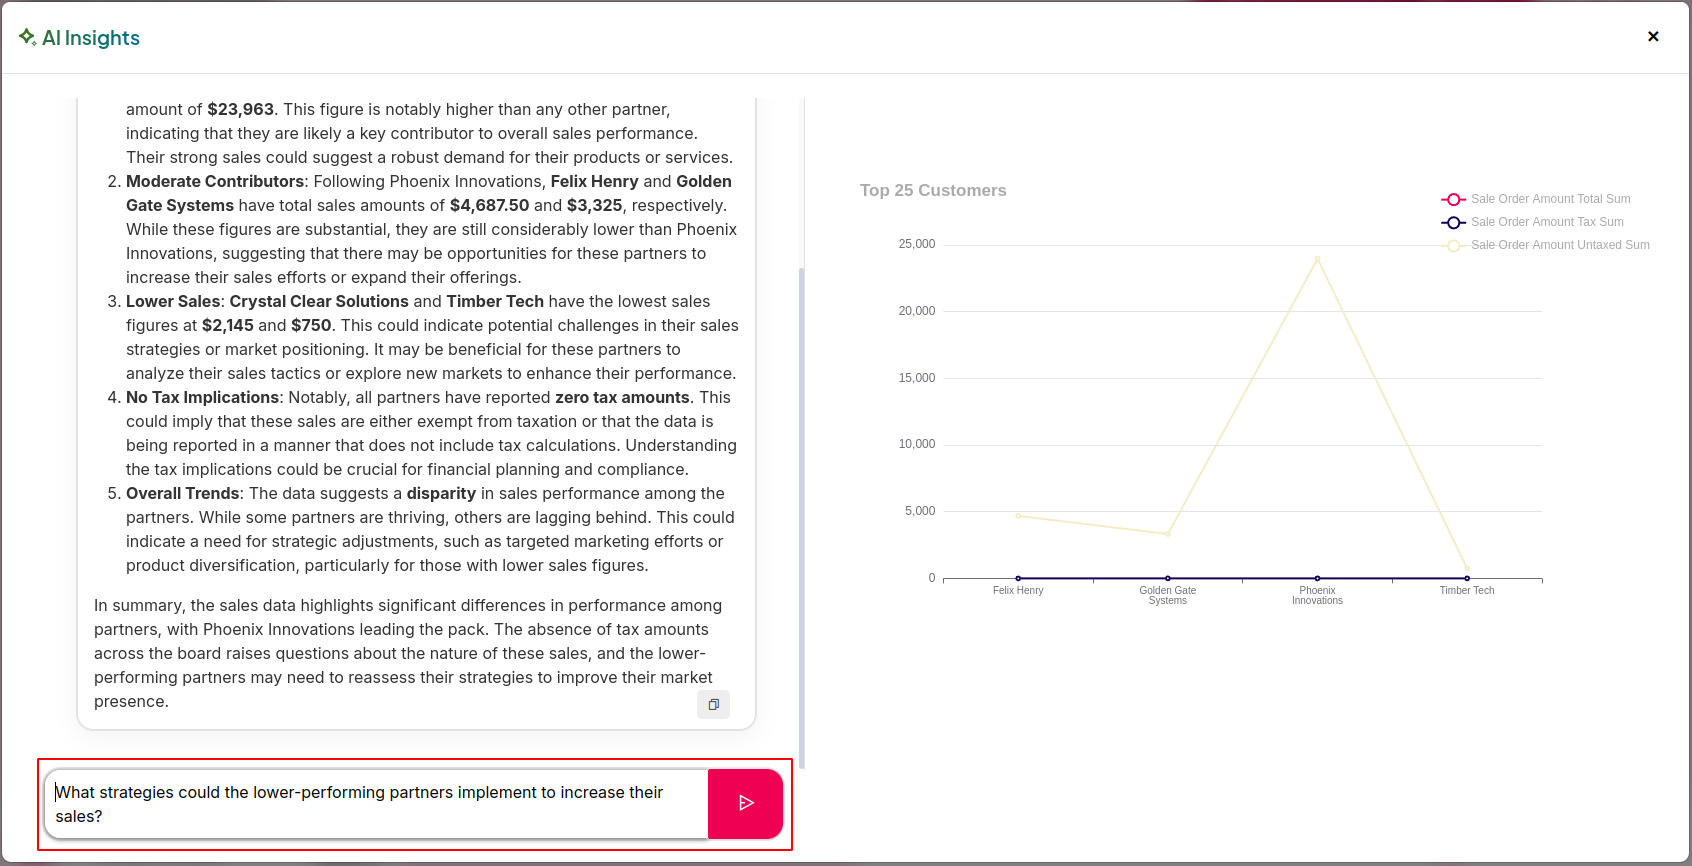
Fig 3.1 — AI insight panel open on a sales chart with a natural-language question entered
How to Ask an AI Question on a Chart:
- Open a dashboard and locate the chart you want to analyse
- Click the AI Insights button on the chart (sparkle or chat icon)
- Type your question in plain language -
for example: "Why did revenue drop in March?" "Which salesperson is underperforming compared to last quarter?" "What is driving the spike in this week's data?" - Cyllo AI analyses the chart data and returns a descriptive answer
- The answer appears in the insight panel alongside the chart
Note
AI Insights works on the data visible in the chart — apply date filters first to scope the analysis to the period you are investigating before asking your question.
3.2 AI Analysis & Explanations
Beyond answering single questions, Cyllo AI can generate a full analytical summary of a dashboard — identifying trends, anomalies, and patterns across all charts in view.
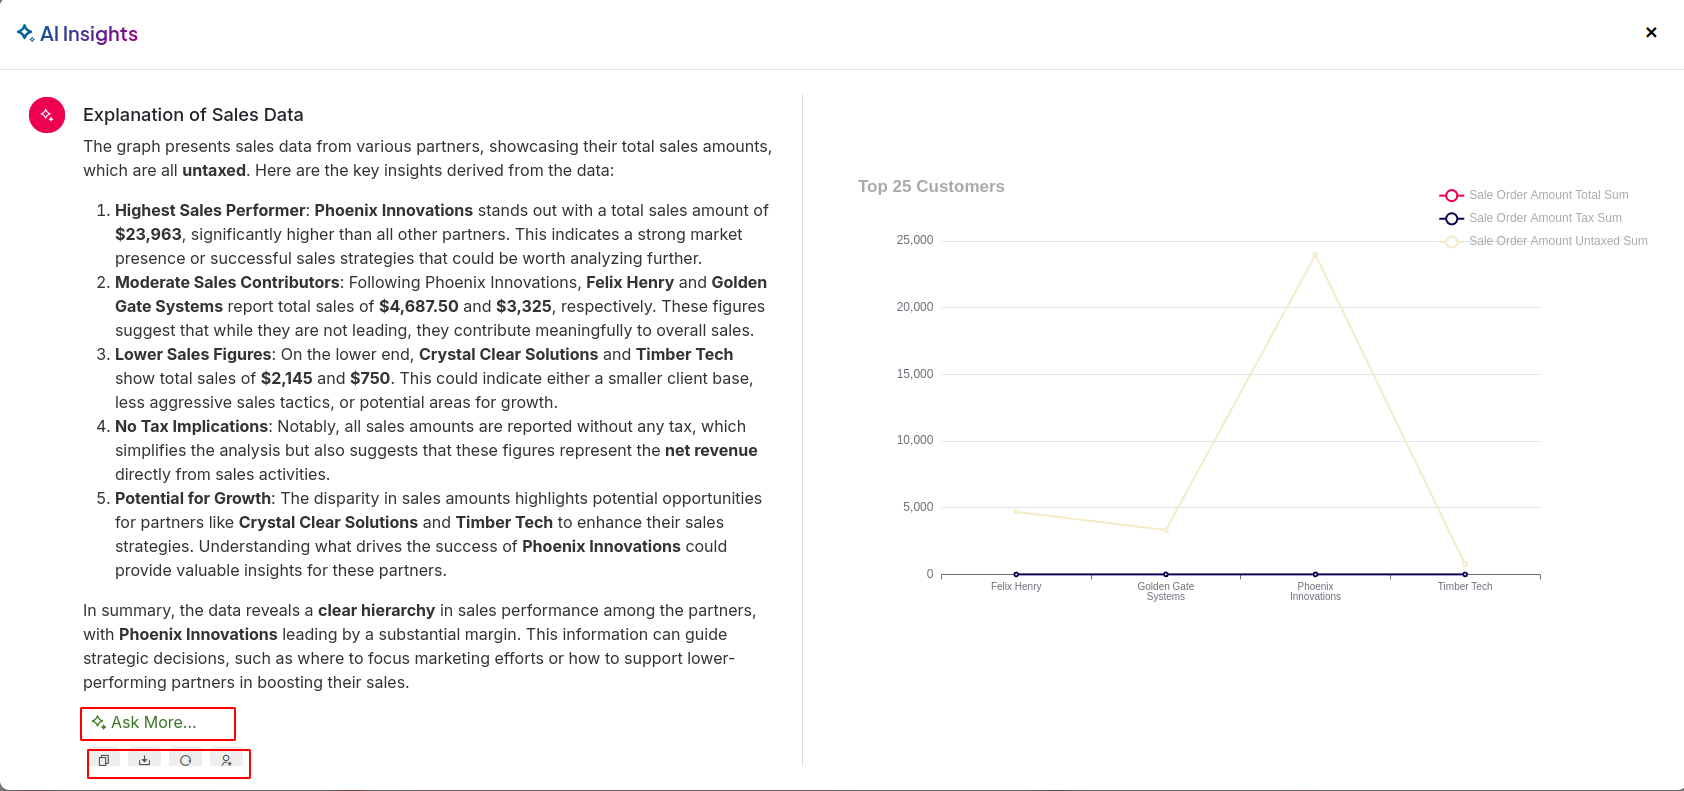
Fig 3.2 — AI-generated dashboard summary with trend analysis and anomaly highlights
How to Generate a Full AI Analysis:
- Open the dashboard
- Click Analyse Dashboard (or the AI summary button)
- Cyllo AI reviews all charts on the dashboard
- It returns a written summary highlighting: top trends, notable changes, outliers, and suggested actions
- The summary updates each time you click Analyse — always reflecting current data
Note
Use the full dashboard analysis for weekly management reports. Copy the AI summary into your report template as a starting point and adjust as needed.
4. Analytical Capabilities
4.1 Sales Forecasting
Cyllo Analytics includes AI-assisted sales forecasting — predicting future revenue based on historical sales patterns to support planning and target setting.
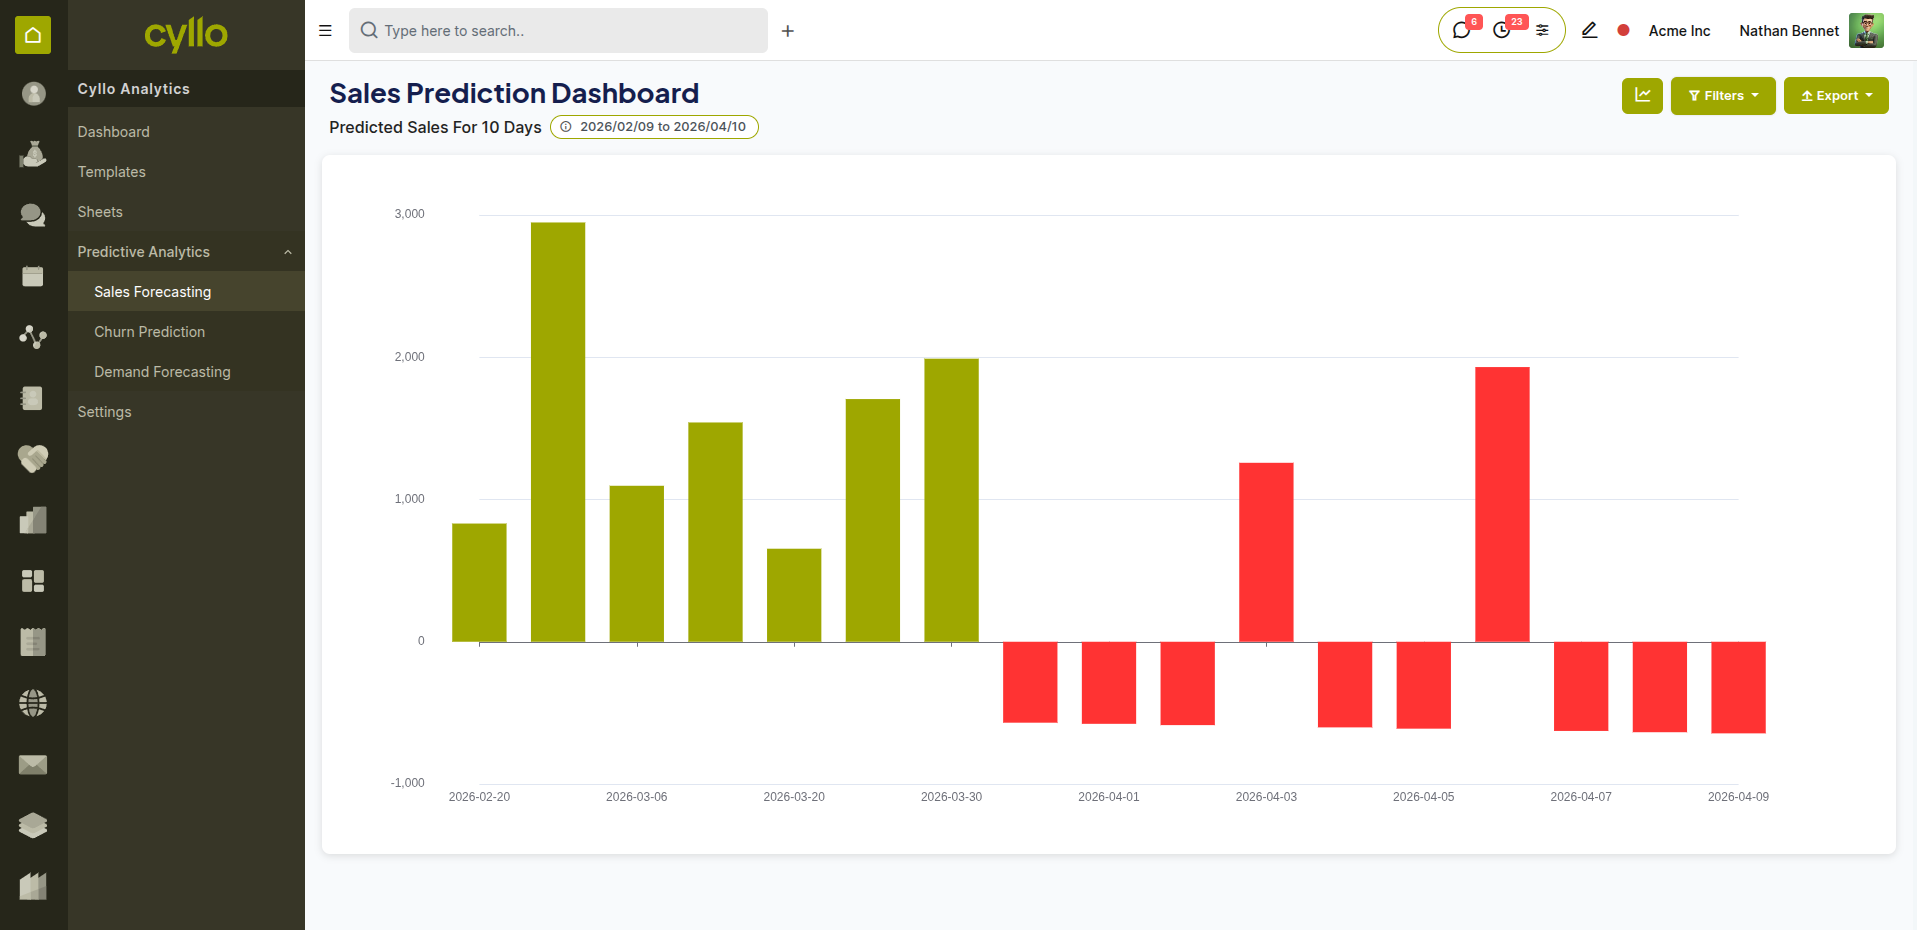
Fig 4.1 — Sales forecast chart showing historical data and projected revenue with confidence interval
How to Access Sales Forecasting:
- Go to Analytics → Sale Analytics → Sales Forecast
- Select the Product or Product Category to forecast
- Set the Forecast Period (e.g., next 30 / 60 / 90 days)
- Set the Frequency: Daily, Weekly, or Monthly
- Cyllo generates a forecast chart with projected values and confidence intervals
- Export the forecast as XLSX for planning or finance review
Key Fields Forecast Period:
- The future time window being projected.
- Frequency: The granularity of the forecast — daily, weekly, or monthly data points.
- Confidence Interval: The upper and lower bounds of the predicted range.
- Historical Baseline: The past data period used to train the forecast model.
Note
Sales forecasts are based on historical order data. For new products or seasonal items with limited history, interpret confidence intervals carefully and validate against market knowledge.
4.2 Demand Prediction
Demand Prediction analyses historical product sales to forecast future demand — helping procurement and inventory teams plan stock levels and avoid shortages or overstock.
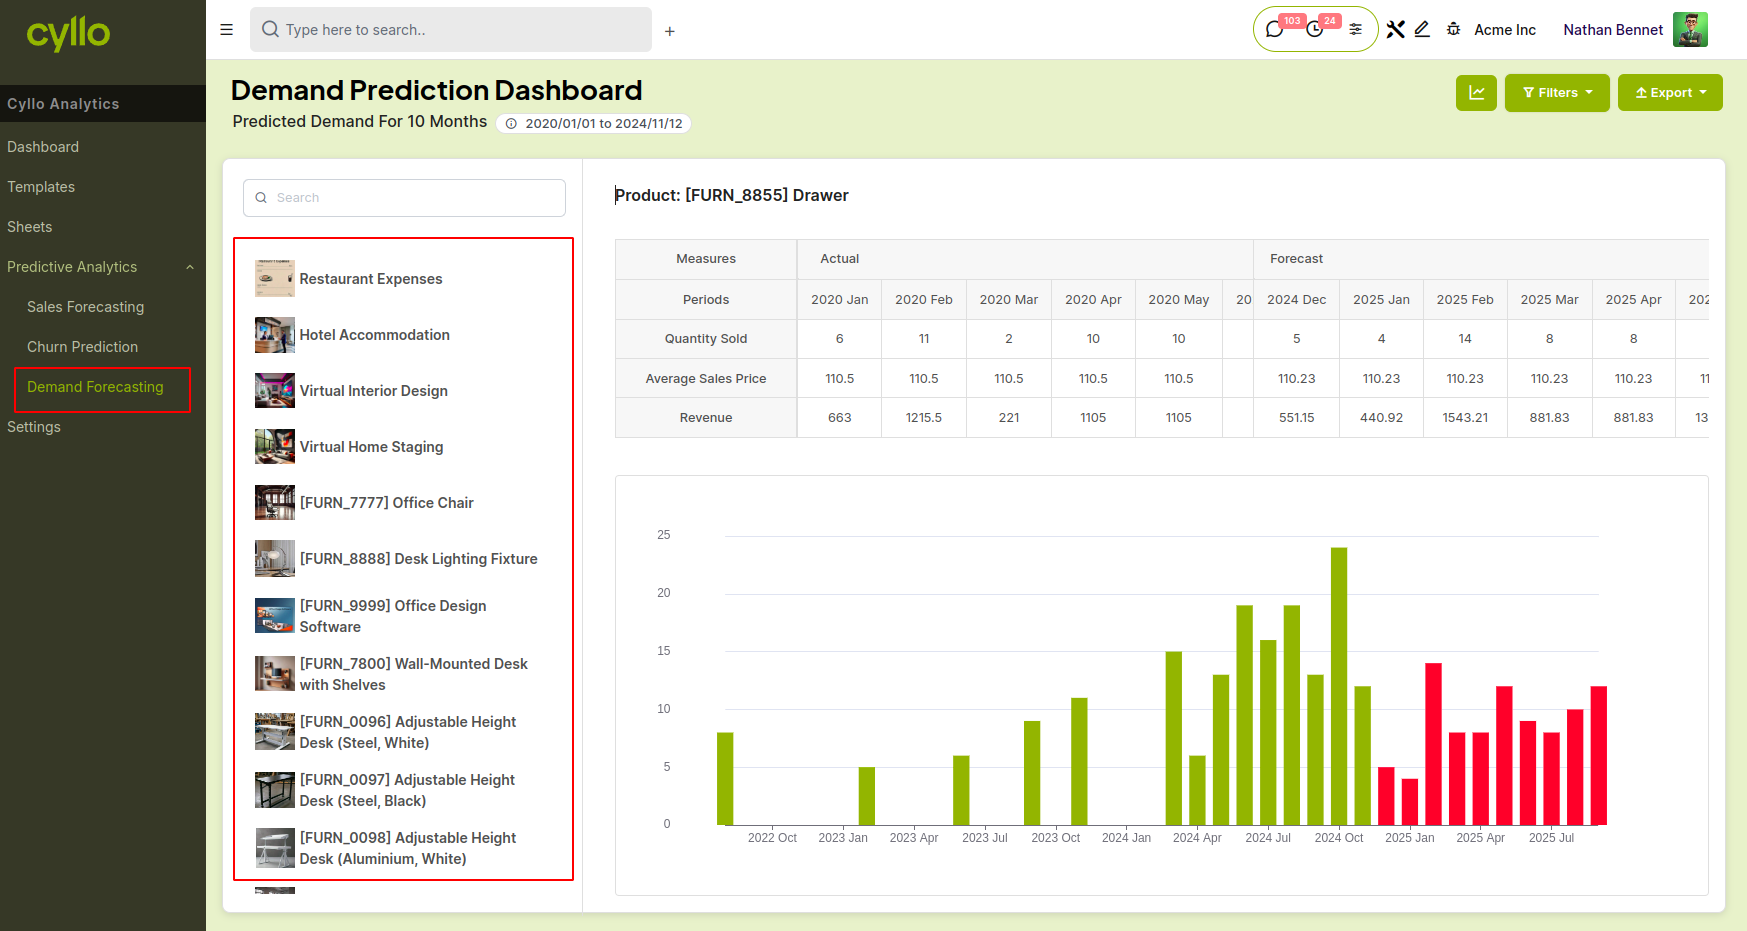
Fig 4.2 — Demand prediction report showing product-level forecast with recommended stock levels
How to Use Demand Prediction:
- Go to Analytics → Sale Analytics → Demand Prediction
- Select the Product to analyse
- Set the Analysis Period (the historical window to base predictions on)
- Review the predicted demand quantity for the coming period
- Use the forecast to set reorder quantities and safety stock levels
- Export as XLSX for procurement planning
Note
Combine Demand Prediction with Cyllo's Inventory reorder rules — set reorder quantities based on the forecast to automate restocking aligned with predicted demand.
4.3 Churn Analytics
Churn Analytics identifies customers who are at risk of stopping purchases — giving sales and account management teams time to intervene before revenue is lost.
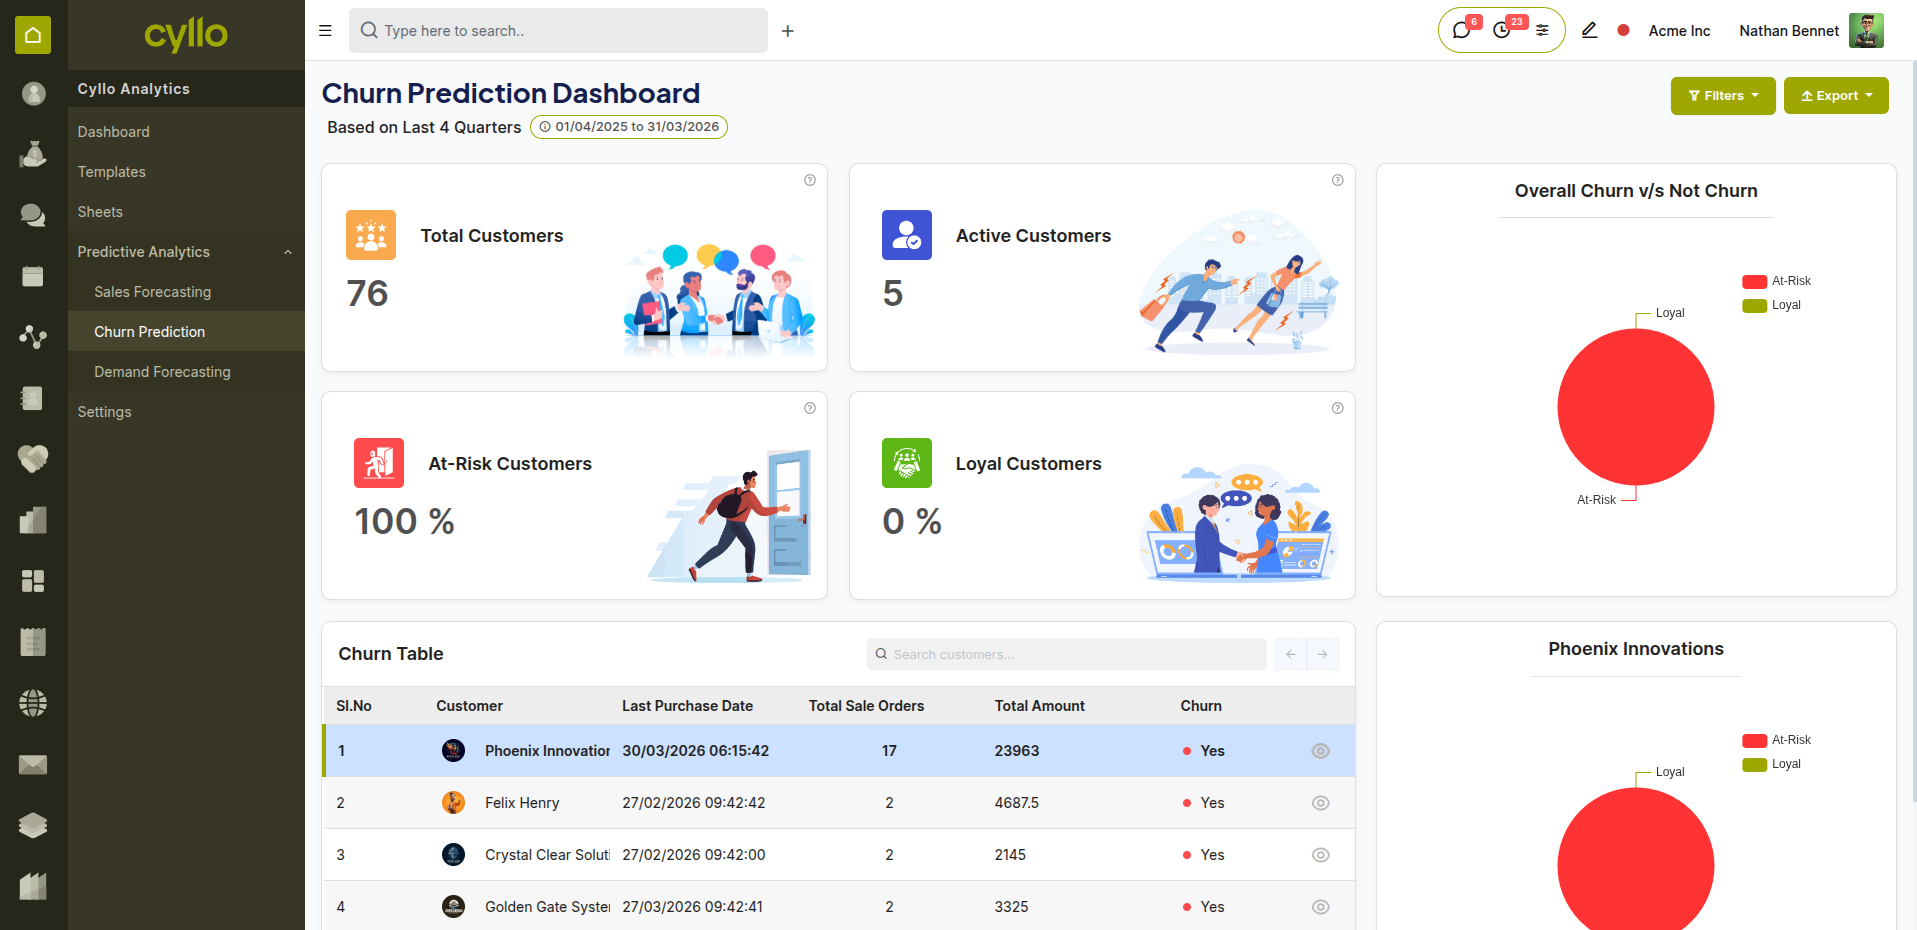
Fig 4.3 — Churn prediction dashboard showing customer risk scores and segments
How to Access Churn Analytics:
- Go to Analytics → Sale Analytics → Churn Prediction
- Set the Analysis Period and Date Range
- Cyllo analyses customer purchase frequency, recency, and value patterns
- Customers are scored by churn risk: Low, Medium, or High
- Review the at-risk customer list and assign follow-up actions
- Export the segment for targeted marketing campaigns or account manager outreach
Key Fields
- Risk Score: The predicted likelihood of a customer churning — Low, Medium, High.
- Last Purchase Date: Most recent confirmed order from this customer.
- Purchase Frequency: Average time between orders — long gaps signal risk.
- Customer Segment: Grouping based on buying behaviour patterns.
Note
Act on High risk customers immediately — assign them to an account manager for a personal outreach call. Use Email Marketing or WhatsApp campaigns to re-engage Medium risk customers at scale.